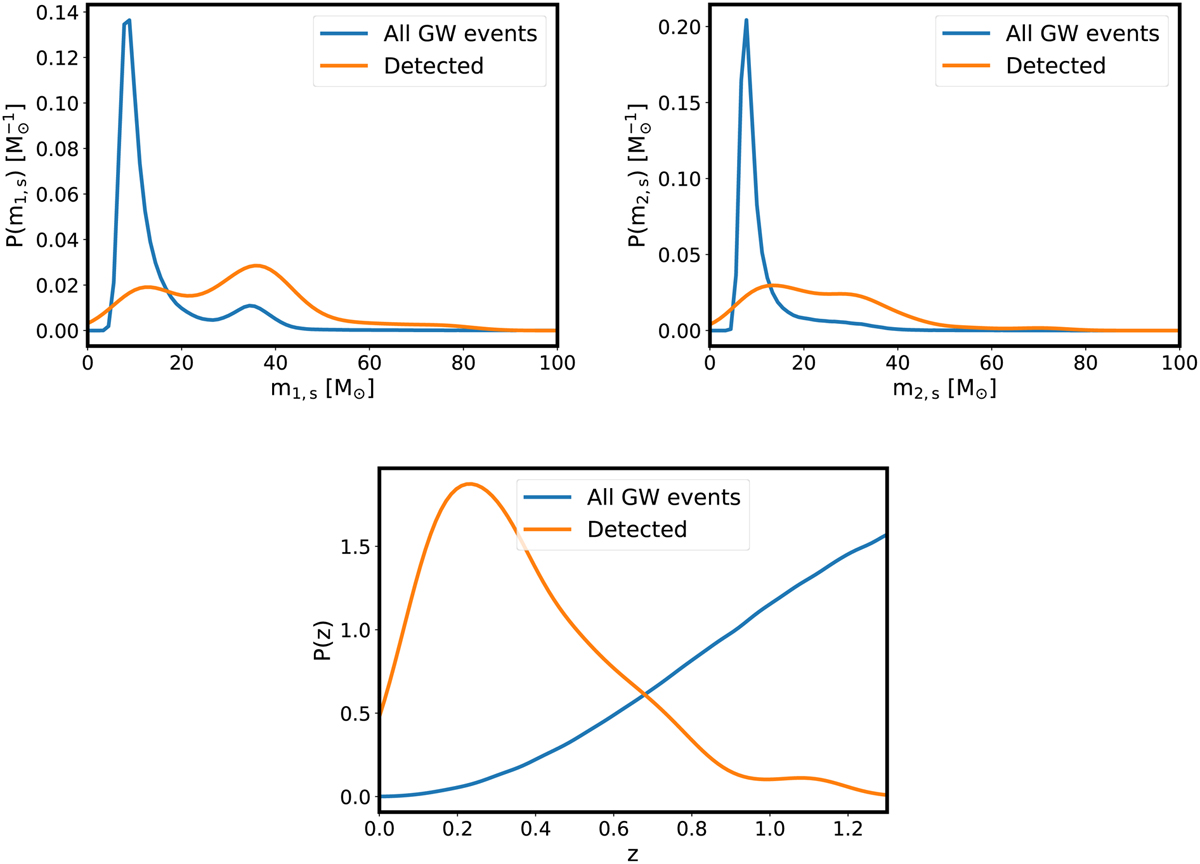
Fig. 4
Download original image
True values of the primary component masses (top left) and lighter component masses (top right) distributions (analytic expression) in the source frame of the detected events for a simulation of O1−, O2−, O3−, and O4−like 3 observational years. The redshifts (bottom) distribution of the events is also shown. The network (S/N) threshold was set to (S/N)thr = 12. In the same plots, the distribution (KDE estimation) of all the simulated (detected and not detected) events can be seen. The population, cosmological, merger rate, and detector parameters are given in Table 4.
Current usage metrics show cumulative count of Article Views (full-text article views including HTML views, PDF and ePub downloads, according to the available data) and Abstracts Views on Vision4Press platform.
Data correspond to usage on the plateform after 2015. The current usage metrics is available 48-96 hours after online publication and is updated daily on week days.
Initial download of the metrics may take a while.