Fig. 15.
Download original image
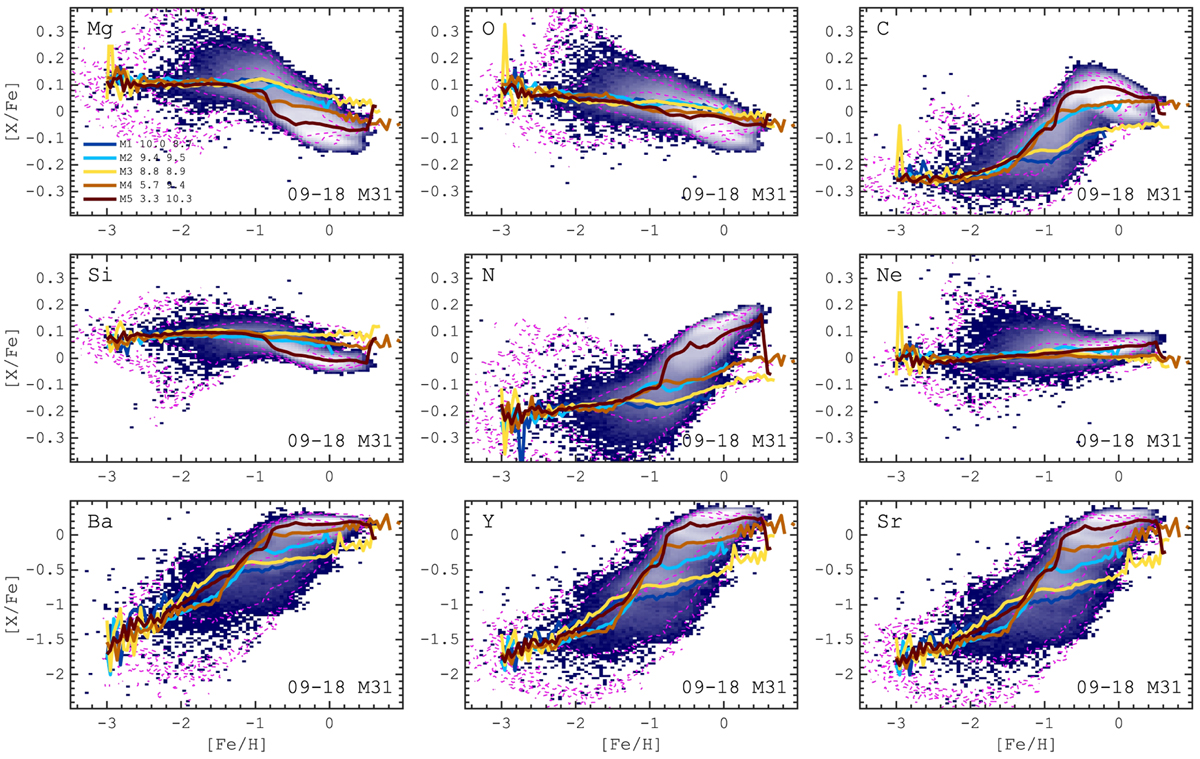
Elemental abundance relations [X/Fe]–[Fe/H] for the M31 galaxy analogue from the 09–18 HESTIA simulation. X is indicated in each panel. Background maps correspond to the in situ stars, while the magenta contours (10−3, 10−2 and 10−1 levels of the normalised density distribution) show all accreted stars distribution. The evolutionary tracks corresponding to the five most significant mergers are shown by the coloured lines. The merger accretion time (Gyr) and the total stellar mass of the merger debris at the time of the merger log10(M*/M⊙) are shown in the top-left panel. The abundance patterns of both the accreted and in situ populations are very similar at very low metallicities ([Fe/H] ≲ −1), while at larger metallicities different merger debris start to be distinguishable from each other.
Current usage metrics show cumulative count of Article Views (full-text article views including HTML views, PDF and ePub downloads, according to the available data) and Abstracts Views on Vision4Press platform.
Data correspond to usage on the plateform after 2015. The current usage metrics is available 48-96 hours after online publication and is updated daily on week days.
Initial download of the metrics may take a while.