Fig. 1.
Download original image
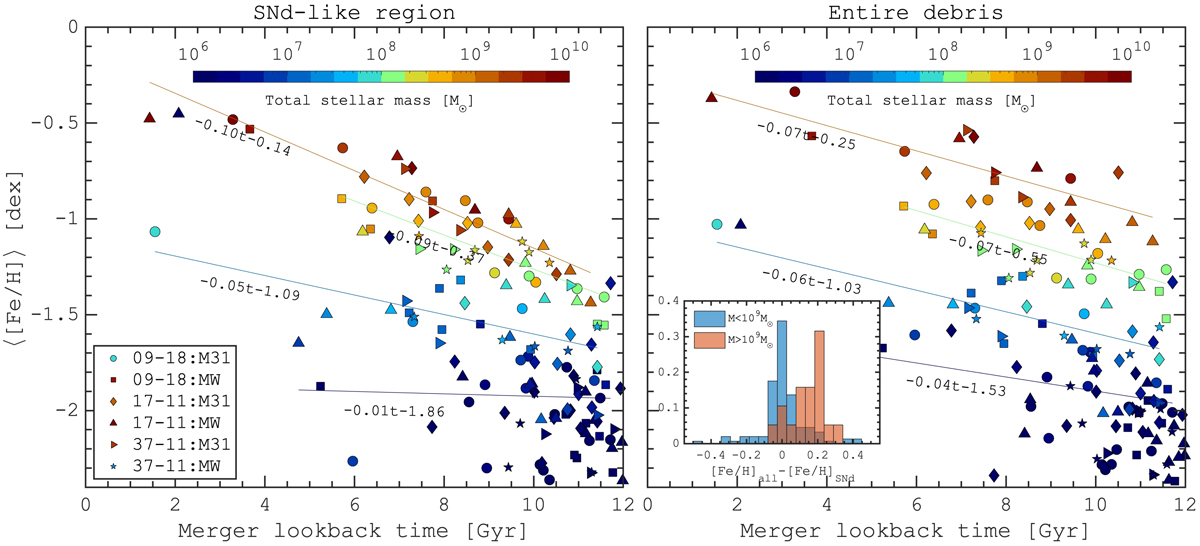
Relation between mean metallicity and merger time for all the merger debris in the six HESTIA galaxies (indicated by different symbols in the bottom left of the left panel). The symbols are colour-coded according to the debris stellar mass. The left and right panels show the SNd-like and the entire population, respectively. In the right panel, the subplot depicts the difference between the mean metallicity of the entire debris and that of the SNd-like region ((0.5 − 2)Rd and |z|< 10 kpc, where Rd is the disk scale length from Libeskind et al. 2020). Two distributions are shown for the low-mass debris (< 109 M⊙, blue) and the high-mass debris (> 109 M⊙, red). The lines of different colours show the linear fits of the mean metallicity-and-merger time relation in several bins of the stellar mass.
Current usage metrics show cumulative count of Article Views (full-text article views including HTML views, PDF and ePub downloads, according to the available data) and Abstracts Views on Vision4Press platform.
Data correspond to usage on the plateform after 2015. The current usage metrics is available 48-96 hours after online publication and is updated daily on week days.
Initial download of the metrics may take a while.