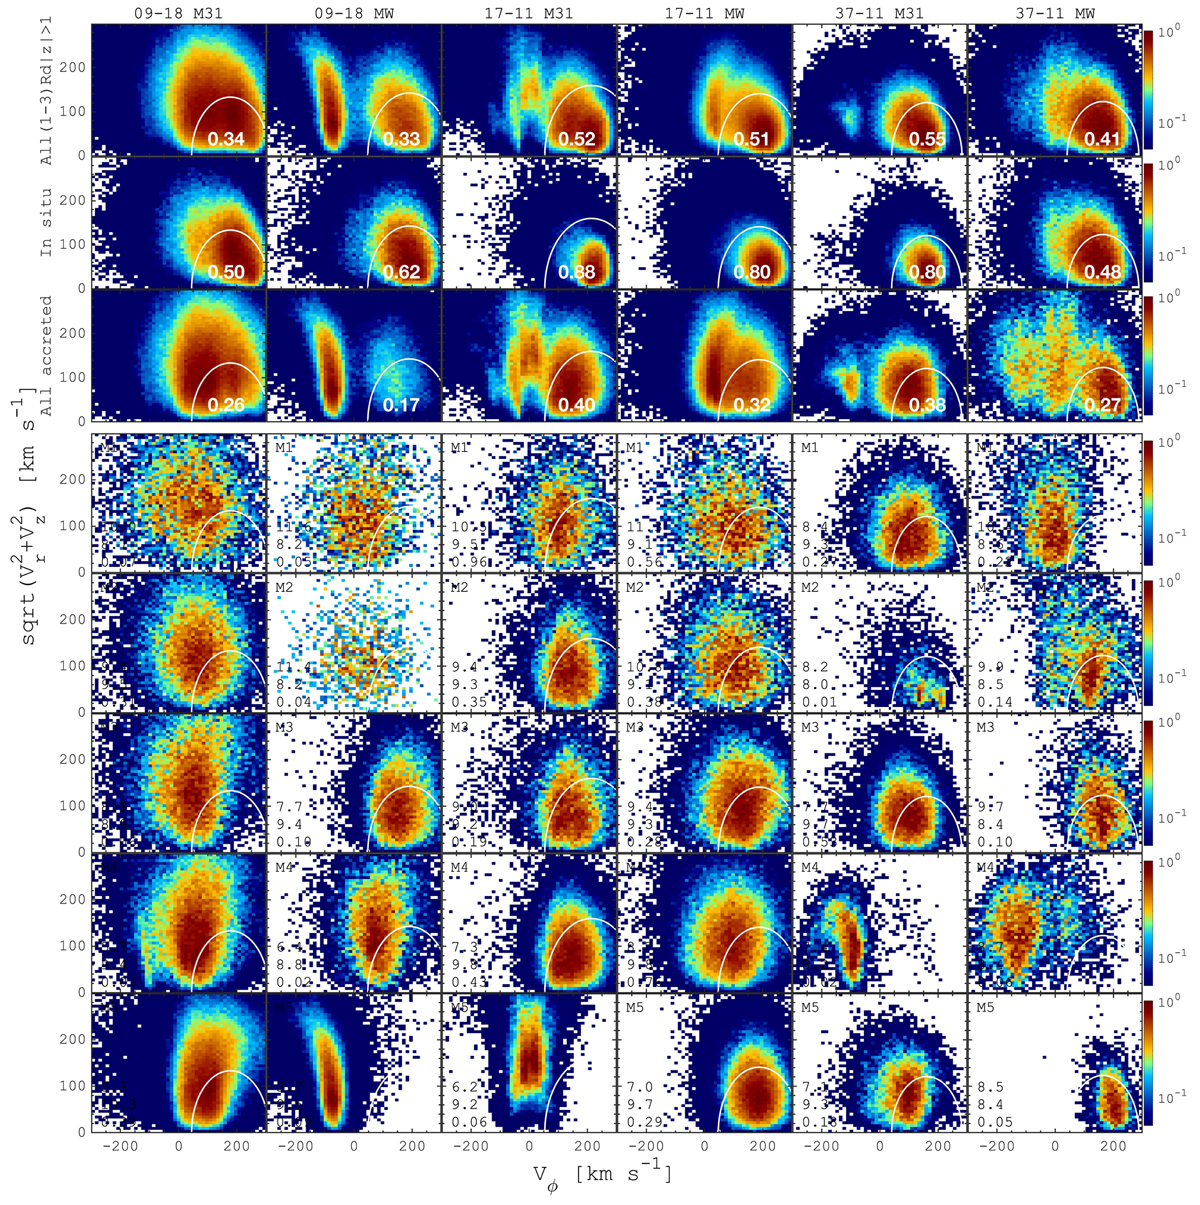
Fig. 15.
Download original image
Toomre diagram for all stars in (1 − 3)Rd (Rd is the disc scale-length) and |z|> 2 kpc (first row), in situ stars (second row), and all accreted populations (third row). The mass fraction of in situ and accreted populations are shown at the bottom in the second and third rows, respectively. The five rows below the gap correspond to the Toomre diagram for five of the most significant mergers at z = 0 (M1–M5; see Fig. 4 in Paper I). The merger accretion lookback time (Gyr), total stellar mass of the merger debris at the time of the merger (log10(M*/M⊙)), and the stellar mass ratio (μ*) relative to the main M31/MW progenitor at the time of the merger are given in the bottom left corner of each panel. The colour bar is in M* scale. The white circle corresponds to the thick disc selection: Vcirc180(km s−1)/240(km s−1), where Vcirc is the circular velocity value at 2Rd for each galaxy; 180 km s−1 corresponds to the selection made for the MW; and 240 km s−1 is the MW circular velocity. We suggest that the disc-like regions in the Toomre diagram are populated by the accreted stars. A single debris spans over a large volume, and, in some cases, the bulk of the accreted stars have (thick) disc-like kinematics.
Current usage metrics show cumulative count of Article Views (full-text article views including HTML views, PDF and ePub downloads, according to the available data) and Abstracts Views on Vision4Press platform.
Data correspond to usage on the plateform after 2015. The current usage metrics is available 48-96 hours after online publication and is updated daily on week days.
Initial download of the metrics may take a while.