Open Access
Fig. 2.
Download original image
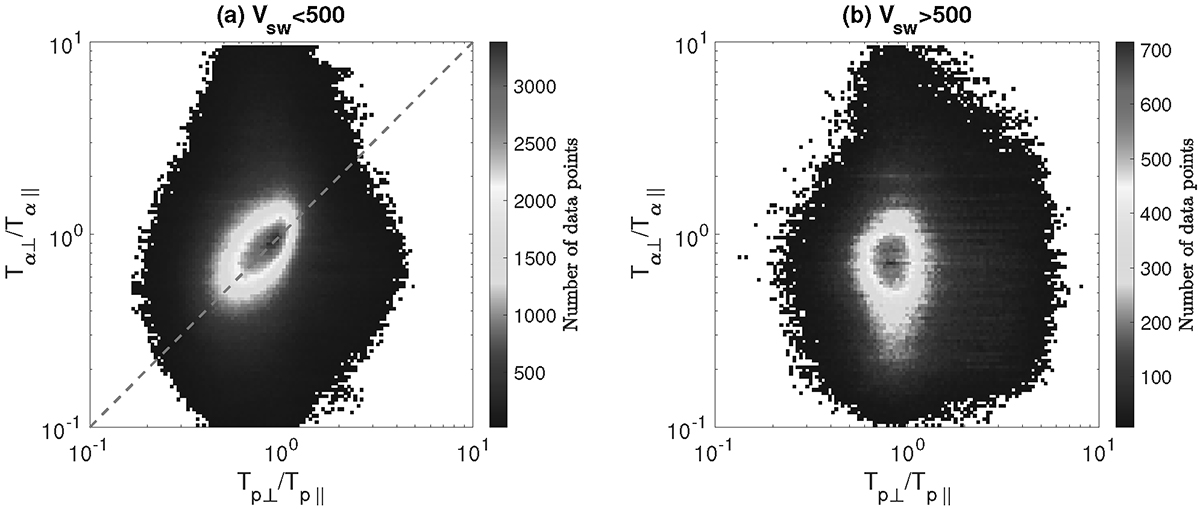
Distribution of data points for the alpha temperature anisotropy in the Tα⊥/Tα∥ − Tp⊥/Tp∥ plane for (a) the slow solar wind with vsw < 500 km s−1, where the dashed line represents the strong correlation Tα⊥/Tα∥ = Tp⊥/Tp∥, and (b) the fast solar wind with vsw > 500 km s−1.
Current usage metrics show cumulative count of Article Views (full-text article views including HTML views, PDF and ePub downloads, according to the available data) and Abstracts Views on Vision4Press platform.
Data correspond to usage on the plateform after 2015. The current usage metrics is available 48-96 hours after online publication and is updated daily on week days.
Initial download of the metrics may take a while.