Open Access
Fig. 7
Download original image
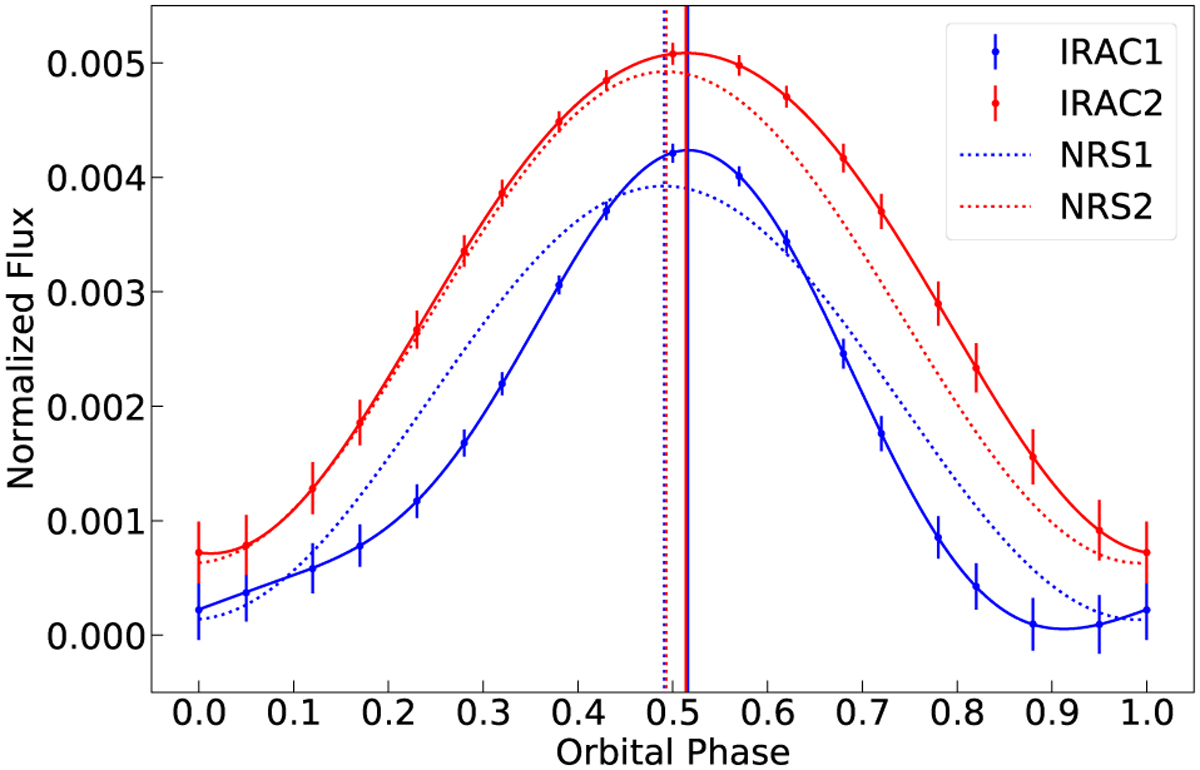
Parametric phase-curve profiles for the Spitzer/IRAC observations analysed in this study (solid lines with error bars) and JWST/NIRSpec G395H inferred from Mikal-Evans et al. (2023; dotted lines). The vertical lines indicate the position of the maxima.
Current usage metrics show cumulative count of Article Views (full-text article views including HTML views, PDF and ePub downloads, according to the available data) and Abstracts Views on Vision4Press platform.
Data correspond to usage on the plateform after 2015. The current usage metrics is available 48-96 hours after online publication and is updated daily on week days.
Initial download of the metrics may take a while.