Fig. 6
Download original image
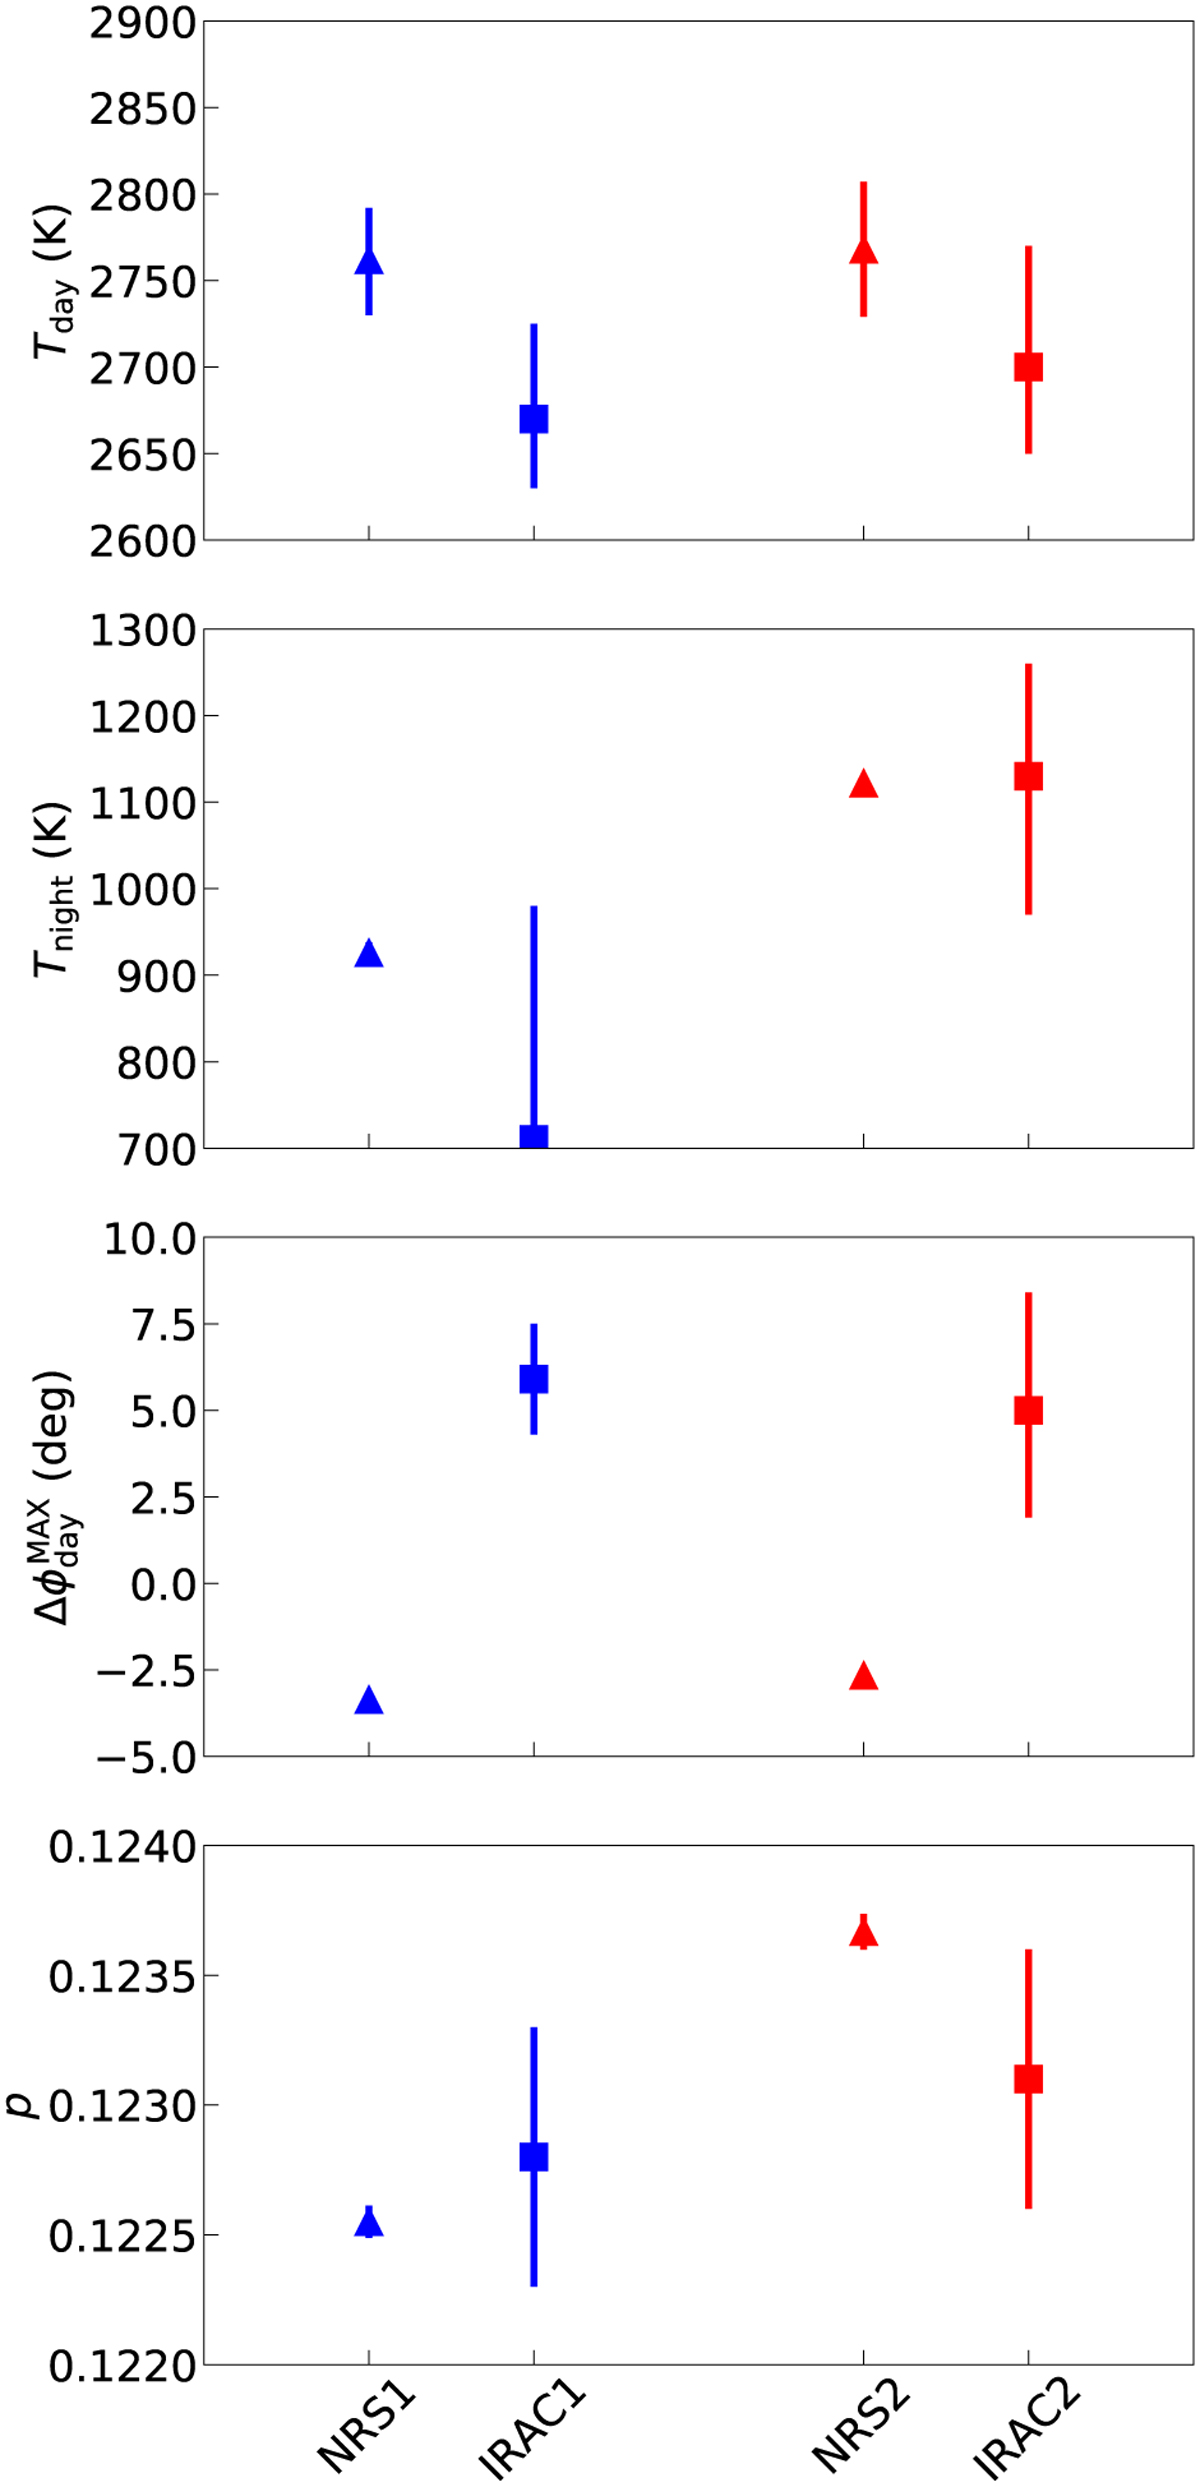
Brightness temperatures inferred for the dayside (left panel) and nightside (right panel) of WASP-121 b, shown at the top. Offsets of the phase-curve maxima relative to conjunction (left panel), and planet-to-star radii ratios (right panel), shown at the bottom. Parameters obtained from the Spitzer/IRAC data are represented with blue and red squares for channel 1 and 2, respectively. Those obtained from the JWST/NIRSpec G395H data are represented with blue and red triangles for NRS1 and NRS2, respectively.
Current usage metrics show cumulative count of Article Views (full-text article views including HTML views, PDF and ePub downloads, according to the available data) and Abstracts Views on Vision4Press platform.
Data correspond to usage on the plateform after 2015. The current usage metrics is available 48-96 hours after online publication and is updated daily on week days.
Initial download of the metrics may take a while.