Fig. 4
Download original image
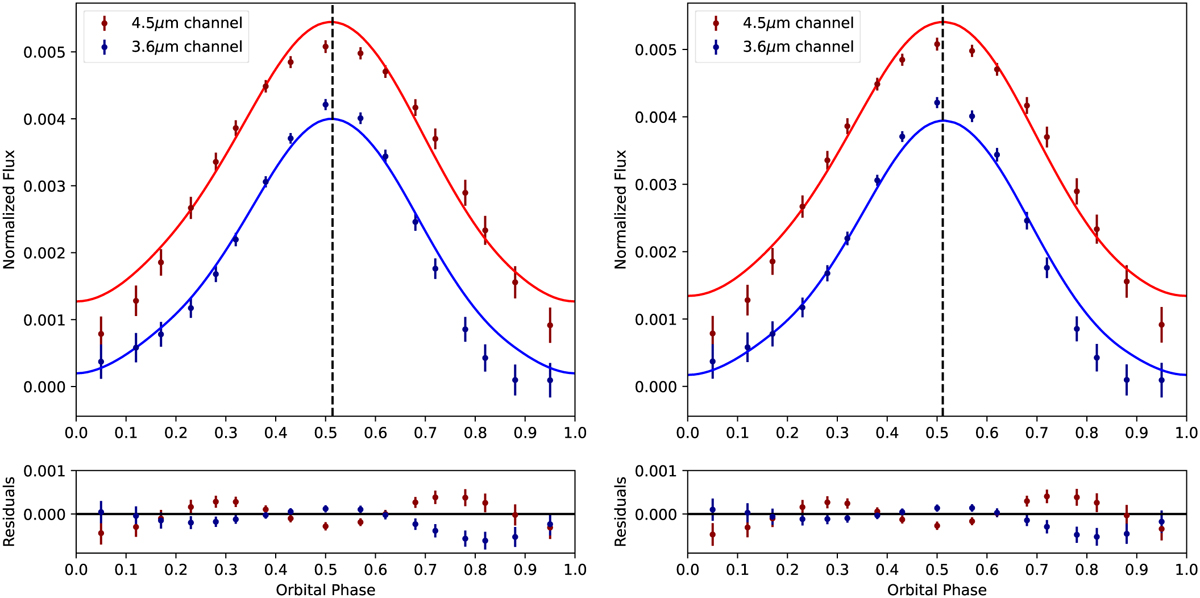
Parametric Spitzer phase curves with error bars based on Eq. (1) and best-fit models from our 1.5D phase-curve retrieval. The dashed vertical lines indicate the position of the hot spot’s centre. Note: the orbital phase has been corrected for the light travel delay, so that mid-eclipse occurs at ϕ′ = 0.5. Left: chemistry is fixed at Zp = 1 Z⊙; Right: chemistry is fixed at Zp = 10 Z⊙.
Current usage metrics show cumulative count of Article Views (full-text article views including HTML views, PDF and ePub downloads, according to the available data) and Abstracts Views on Vision4Press platform.
Data correspond to usage on the plateform after 2015. The current usage metrics is available 48-96 hours after online publication and is updated daily on week days.
Initial download of the metrics may take a while.