Open Access
Fig. 2
Download original image
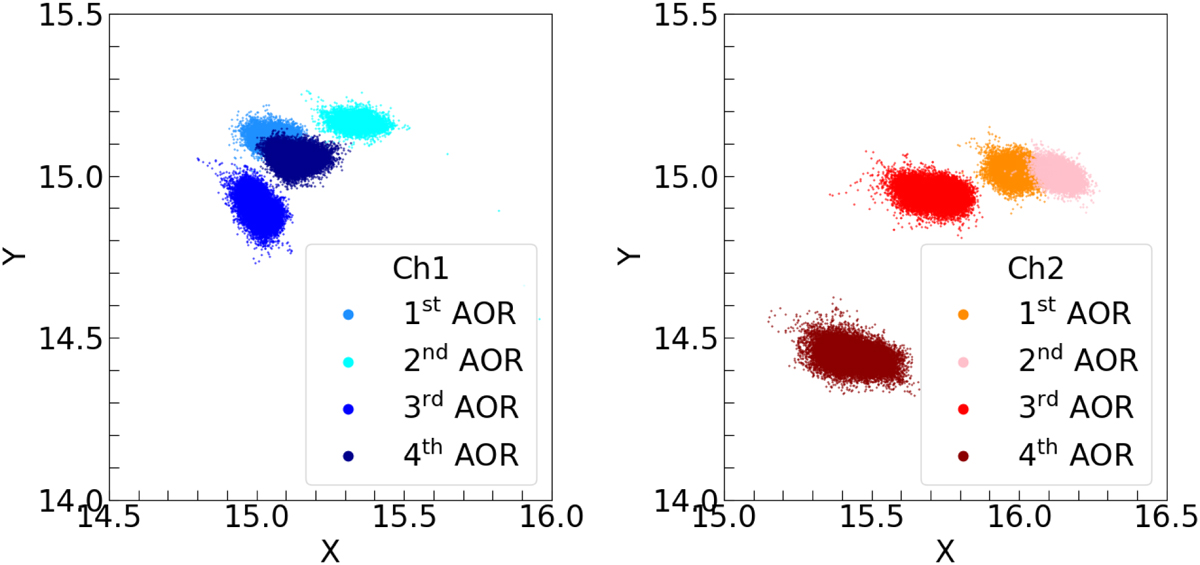
Centroid coordinates of the Spitzer/IRAC images, using different colours for each AOR (as in Fig. 1). Note: there are pointing offsets of few tenths of pixels between consecutive AORs.
Current usage metrics show cumulative count of Article Views (full-text article views including HTML views, PDF and ePub downloads, according to the available data) and Abstracts Views on Vision4Press platform.
Data correspond to usage on the plateform after 2015. The current usage metrics is available 48-96 hours after online publication and is updated daily on week days.
Initial download of the metrics may take a while.