Fig. 1
Download original image
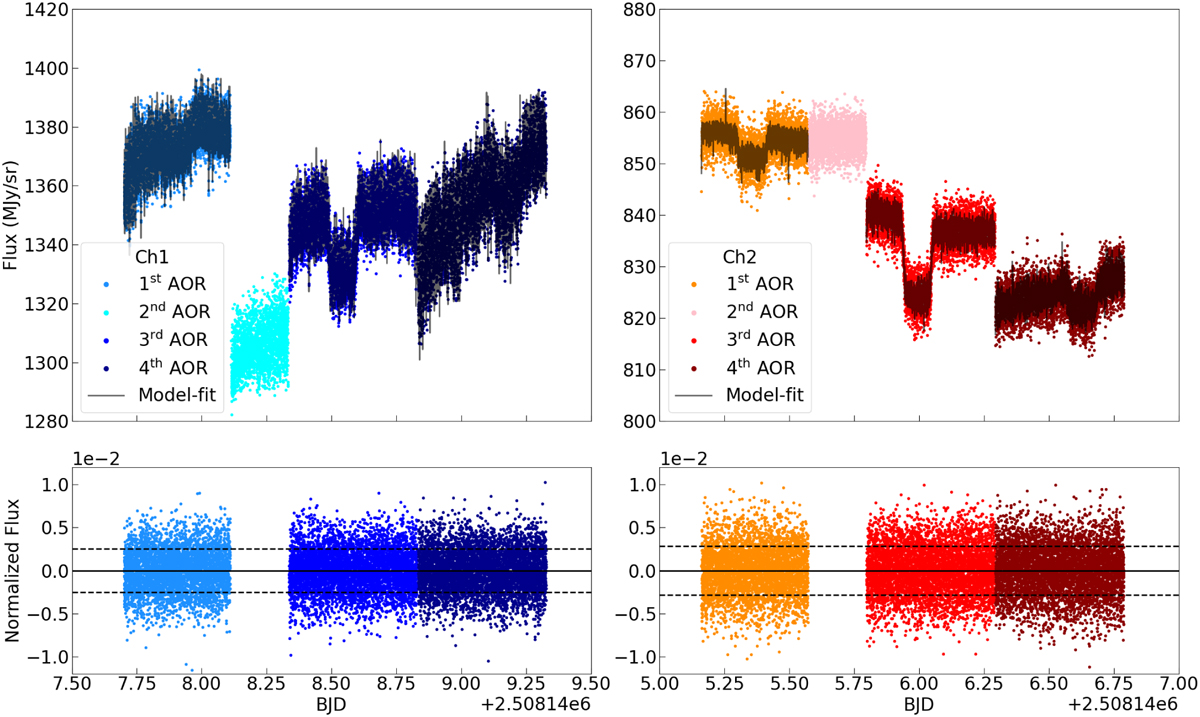
Raw light curves obtained for the Spitzer/IRAC observations at 3.6 µm (left panel) and 4.5 µm (right panel), shown at the top and represented by dots of different colours for each AOR. The relevant best-fit models, including instrumental systematics, are overplotted with solid lines. Note that the second AOR of each visit was discarded from the light-curve fits. The bottom panels show residuals from the above light curves and models (dots), and standard deviations (black lines).
Current usage metrics show cumulative count of Article Views (full-text article views including HTML views, PDF and ePub downloads, according to the available data) and Abstracts Views on Vision4Press platform.
Data correspond to usage on the plateform after 2015. The current usage metrics is available 48-96 hours after online publication and is updated daily on week days.
Initial download of the metrics may take a while.