| Issue |
A&A
Volume 676, August 2023
|
|
|---|---|---|
| Article Number | L8 | |
| Number of page(s) | 7 | |
| Section | Letters to the Editor | |
| DOI | https://doi.org/10.1051/0004-6361/202346574 | |
| Published online | 10 August 2023 | |
Letter to the Editor
Rocky sub-Neptunes formed by pebble accretion: Rain of rock from polluted envelopes
1
Astrophysics Research Center (ARCO), Department of Natural Sciences, The Open University of Israel, Raanana 4353701, Israel
e-mail: This email address is being protected from spambots. You need JavaScript enabled to view it.
2
Department of Astronomy, Tsinghua University, 30 Shuangqing Rd, 100084 Beijing, PR China
Received:
2
April
2023
Accepted:
28
July
2023
Abstract
Sub-Neptune planets formed in the protoplanetary disk accreted hydrogen-helium (H,He) envelopes. Planet formation models of sub-Neptunes formed by pebble accretion result in small rocky cores surrounded by polluted H,He envelopes, where most of the rock (silicate) is in vapor form at the end of the formation phase. This vapor is expected to condense and rain out as the planet cools. In this Letter, we examine the timescale for the rainout and its effect on the thermal evolution. We calculate the thermal and structural evolution of a 10 M⊕ planet formed by pebble accretion, taking into account material redistribution from silicate rainout (condensation and settling) and from convective mixing. We find that the duration of the rainout in sub-Neptunes is on an ∼Gyr timescale and varies with envelope mass: planets with envelopes below ∼0.75 M⊕ rain out into a core-envelope structure in less than 1 Gyr, while planets in excess of 0.75 M⊕ of H,He preserve some of their envelope pollution for billions of years. The energy released by the rainout inflates the radius with respect to planets that start out from a plain core-envelope structure. This inflation would result in estimates of the H,He contents of observed exoplanets based on the standard core-envelope structure to be too high. We identify a number of planets in the exoplanet census where rainout processes may be at work, plausibly resulting in their H,He contents to be overestimated by up to a factor two. Future accurate age measurements by the PLATO mission may allow for the identification of planets formed with polluted envelopes.
Key words: planets and satellites: interiors / planets and satellites: physical evolution / planets and satellites: formation / planets and satellites: composition
© The Authors 2023
 Open Access article, published by EDP Sciences, under the terms of the Creative Commons Attribution License (https://creativecommons.org/licenses/by/4.0), which permits unrestricted use, distribution, and reproduction in any medium, provided the original work is properly cited.
This article is published in open access under the Subscribe to Open model. This email address is being protected from spambots. You need JavaScript enabled to view it. to support open access publication.
1. Introduction
The radius valley (Fulton et al. 2017) splits the population of close-in exoplanets into two groups: bare rocky objects and planets of larger radii. This dichotomy may distinguish dry super-Earths from sub-Neptunes, which contains lighter materials, either volatiles and/or hydrogen and helium (hereafter, H,He). While the interior structure of super-Earth planets can be modeled to some degree from the Earth’s structure, the structure of sub-Neptunes is still unclear. Based on the detected radii and masses, close-in sub-Neptunes contain only a few percent of H,He and volatiles. Planet formation models predict more gas for planets in this mass range (Lee & Chiang 2015; Mordasini 2020; Ormel et al. 2021), where mass loss processes after disk dissipation removed some of the gas (Owen & Wu 2013; Gupta & Schlichting 2020; Rogers & Owen 2021). If so, sub-Neptune planets residing farther out may have thicker envelopes than the close-in planets we observe today.
Planet formation models of rocky sub-Neptune planets show that solid sublimation in the growing gas envelope lead to massive pollution of the envelope with silicate vapor once a planet exceeds about 2 M⊕ (Bodenheimer et al. 2018; Brouwers et al. 2018; Ormel et al. 2021). The formation of sub-Neptunes by rocky pebble accretion results in a typical structure that is made up of a small rocky core surrounded by a silicate vapor composition gradient and a vapor-rich convective envelope on top of it (Ormel et al. 2021). The progressive cooling of these planets leads to over-saturation of the silicate vapors in the envelope and consequently condensation and settling (rainout) of rock droplets to deeper undersaturated layers. Rain-out sweeps the silicate from the outer layers downwards and enhances late core growth (Brouwers & Ormel 2020). The rainout phase terminates in a core-envelope structure, where further cooling does not change the interior structure. The timescale for rainout depends on the thermal evolution of the planet. Brouwers & Ormel (2020) estimated the timescales for rainout in super-Earths to be billions of years, calculated for uniformly polluted envelopes, based on an ideal gas and adiabatic cooling scheme. Other recent works have explored the implications of hydrogen-rock distribution in the interior of sub-Neptune planets, in which the structure does not evolve into a core-envelope structure (Markham et al. 2022; Misener & Schlichting 2022) or where the rainout process has not been explicitly modeled (Bodenheimer et al. 2018).
In this Letter, we connect planet formation to evolution. We numerically calculate the post-formation evolution of a 10 M⊕ sub-Neptune formed by rocky pebble accretion. We consider a simultaneous thermal and structural evolution of the interior, which has a silicate composition gradient and a polluted envelope at formation. In particular, we follow the rainout process and its consequences for the radius evolution and mass–radius relation. The 10 M⊕ example was selected as an intermediate case to emphasize the difference between interiors of smaller super-Earths and larger Neptunes. A companion paper describes the evolution of 5–20 M⊕ planets formed by rocky pebble accretion under various conditions (Vazan et al., in prep.).
2. Method
In this section, we describe the new methods used in this work, which build upon the interior evolution methods and results of previous works (Vazan et al. 2015, 2018, 2022).
The initial model is the outcome of planet formation model of rocky pebble accretion (Ormel et al. 2021). The formation model was calculated for a solid accretion rate of 10−5 M⊕ yr−1 with both gas and pebbles contributing to the opacity. At the end of the formation phase, the young 10 M⊕ planet is embedded in the protoplanetary disk at 0.2 AU, and its radius is the Hill radius (about 100 R⊕). It contains 6.7 M⊕ of metal (silicate rock) and 3.3 M⊕ of gas (H,He). More details on the planet formation model appear in Appendix A.
The input parameters are similar to what we used in the planet formation model: the equations of state of H, He (Saumon et al. 1995), and SiO2 rock (Faik et al. 2018) are the same as in the formation study. Irradiation by the parent star is for the same location as in the disk phase (i.e., no migration). Since we do not expect grains or pebbles to remain in the envelope in the long-term evolutionary process (Brouwers et al. 2021; Movshovitz et al. 2010; Ormel 2014; Mordasini 2014), the radiative opacity is that of a grain-free solar metallicity atmosphere (Freedman et al. 2014).
The thermal evolution model was calculated for the entire interior (from the center to surface) on one mass grid, with no distinction between core and envelope. The model solves the interior structure and evolution equations, according to Eqs. (1)–(5) from Vazan et al. (2015), which allows for heat transport by convection, radiation, and conduction, depending on local conditions over time (described in Eqs. (11) and (12) in Vazan et al. 2015). The redistribution of composition is by convective mixing where the convection criterion is fulfilled, and by rainout in oversaturated regions. Convective-mixing is calculated as described in the appendix in Vazan et al. (2015). In this work, we add the simulation of composition redistribution by rainout, as explained in the next paragraph.
The rainout model simulates the condensation and settling of silicate vapor from an over-saturated layer into an undersaturated layer below, similar to the approach of Stevenson et al. (2022) for modeling the evolution of Jupiter. For consistency with the formation models (Ormel et al. 2021), we used the same liquid-vapor curve of Kraus et al. (2012), seen in the lower branch, to determine the saturation in the interior:
 (1)
(1)
where a = 9.0945, b = 5.630 × 10⁴ K, c = 13.26, and Tcp = 5130 K is the critical point of SiO2. As the planet cools along the evolution, whenever the silicate mass fraction in a certain layer, Zi, exceeds the saturation level, Zi, sat, we remove the excess of silicate (above the saturation level) to the layer below it. Numerically, if Zi > Zi, sat at a time, t, in the layer, i, the silicate mass fraction is:
 (2)
(2)
and the excess of rock (Zi − Zsat)mi is removed from layer i to the layer below it, enhancing its metallicity. The rock droplets are assumed to instantaneous fall between layers, as the droplets settling time is much shorter than the Kelvin–Helmholtz time. The energy of the rainout (in the form of latent heat of condensation and the settling energy) are included in the evolution model via the equation of state and the interior structure equations, respectively. For simplicity, here we ignore the effect of convective inhibition in condensation front on slowing the heat transport (Guillot 1995; Leconte et al. 2017; Markham et al. 2022).
Mass loss is included in the thermal evolution model, by removal of the mass from the outermost layer of the planet at a constant rate. Since the rainout of rock droplets from the oversaturated layer is fast, mass loss (when it occurs) is made up of hydrogen and helium – and not of silicates. The rate of mass loss by stellar XUV depends on assumptions on atmospheric absorption and stellar properties, and the range of possible outcomes is quite broad (e.g., Lopez et al. 2012; Mordasini 2020; King & Wheatley 2021; Kubyshkina & Fossati 2022). Therefore, we used constant mass loss rates to achieve mass loss fractions amounting to 0–0.9 of the initial post-disk envelope mass within the first 0.1 Gyr, when the stellar XUV is strong.
3. Results
3.1. Sub-Neptunes with massive envelope from formation
The planetary formation phase ends with the dissipation of the disk and rapid contraction of the outer diluted gas layers from 100 R⊕ to about a tenth of that size within a few million years. Despite the significant radius contraction, the density and composition distribution in the deep interior is nearly unaffected. After the rapid contraction, the long term cooling of the outer metal-rich envelope of this planet is governed by large scale convection, while the cooling of the deeper composition gradient is by conduction and/or layered convection, which is less efficient. Consequently, the metal-rich envelope cools faster and the silicate vapor becomes oversaturated, while the deep interior remains very hot and thus undersaturated. As a result, metal starts to condense and settle (rainout) into deeper layers. As the planet cools the condensation front moves deeper in the interior. Since the liquid-vapor curve is a strong function of temperature, the layers above the condensation front are almost metal-free.
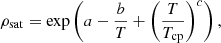
We find that the effect of rainout on the structure of rocky sub-Neptunes formed by pebble accretion is significant. In Fig. 1, we show the silicate (Z) mass fraction distribution (left) and temperature profile (right) of the 10 M⊕ planet located at 0.2 AU. The initial state, based on the results of the formation model (dashed) and after 0.1, 1, and 5 Gyr (solid) are shown. Although the planet’s interior at the end of the formation phase contains most of its silicate as vapor in the polluted envelope, after 5 Gyr all the silicate vapor has condensed and settled and the planet has transitioned to a core-envelope structure.
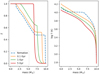 |
Fig. 1. Silicate mass fraction (left) and temperature profile (right) of a 10 M⊕ sub-Neptune with 33% H,He located at 0.2 AU. Profiles are shown at different evolution phases. See Appendix A for more details on the initial (planet formation) profiles. |
Interestingly, the redistribution of silicate in the planet’s interior is found to take place on a timescale of a billion years, as shown in Fig. 2. The early fast contraction increases the temperate at the outer layers in the first 10 Myr and, therefore, a significant amount of silicate rainout only starts after about 20 Myr. The rain-out continues as the planet cools and ends when all the silicates are located in a rocky core, at age of 4.25 Gyr for this 10 M⊕ sub-Neptune. The simulation shown in Fig. 2 refers to a planet with its initial gas content of 33% in mass (no mass loss). Since the H,He amount may decrease after disk dissipation, we go on to examine (in Sect. 3.2) how the rainout timescale changes with envelope mass.
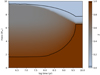 |
Fig. 2. Silicate mass fraction (color) as a function of interior layers (y axis) and time (x axis). Silicate mass fraction ranges between zero (gas only) in blue and pure silicate in brown. The gradual distribution of silicate from formation converges into a core-envelope structure after about 4.25 Gyr. The solid lines signify Z = 0.98 and Z = 0.02 enrichment levels. Versions of this figure for radius and pressure layers instead of mass are presented in Appendix B. |
The rainout releases energy from the condensation process (latent heat) and gravitational settling. Moreover, the settling erases parts of the original composition gradient, resulting in the release of formation energy that was stored there, a consequence of low heat transport efficiency in regions characterized by composition gradients. These energy sources cause the planet radius to expand for over the duration of the rainout period. When the rainout terminates the three energy sources vanish and the efficient (convective) cooling results in faster radius contraction. In the left panel of Fig. 3, we present a comparison between the radius of a raining-out planet (red) formed by pebble accretion to a similar planet with static structure, that is, no rainout1 (dashed black) and to a similar planet with core-envelope structure from formation (solid black). As is shown, the effect of rainout on radius evolution is significant. The luminosity of the planets is shown in the right panels, indicating significant luminosity increase by the rainout.
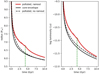 |
Fig. 3. Radius (left) and luminosity (right) evolution of the 10 M⊕ planet shown in Figs. 1 and 2 (red). The evolution of same planets without rainout (dashed black) and with core-envelope structure from formation (solid black) are shown for comparison. The green vertical line signifies the end of the rainout phase. Radius inflation at that point is 7.8% in comparison to the core-envelope case. |
We define the rainout timescale as the time from formation until all the silicates have settled and a core-envelope structure has been achieved. We define maximum radius inflation as the radius change at the end of the rainout phase, in comparison to a similar (mass and composition) planet formed with core-envelope structure at the same age. In Fig. 3, we illustrate the end of the rainout phase, that is, when the planet reaches a core-envelope structure, shown by the green vertical dashed line. The rainout timescale is t = 4.25 Gyr and the maximum radius inflation is ΔR/R = 0.078. As can be seen, the slope of the radius evolution changes since the planet become fully adiabatic and cools more efficiently from that point.
The radius inflation of the planet in Fig. 3 is retained in the post-rainout phase. The energy release from massive envelopes is slow and the radius evolution is therefore delayed in comparison to planets formed with core-envelope structure. In other words, planets that formed with polluted massive envelopes would look “younger” than planets that formed by a core-envelope, caused by the later rainout heat release. The radius of the raining-out planet shown in Fig. 3 is 2.5 Gyr younger along the post-rainout evolution, than a similar planet that formed with a core-envelope structure. Alternatively, if age is known this larger radius might be inferred as a higher H,He content for such observed planets, as discussed in the next section.
3.2. Sub-Neptunes with lower mass envelopes
The duration of the rainout phase depends on the planet’s cooling efficiency, hence, on the blanketing effect of the envelope. Thicker envelopes will retain interior heat for longer. In some cases the initial envelope (or part of it) is lost after the disk dissipates by XUV radiation from the star. The sub-Neptune shown in Fig. 2 contains 33% of H,He from formation, but a large fraction of this envelope can be removed in close-in sub-Neptunes – up to a total loss (e.g., Owen & Wu 2013; Rogers & Owen 2021).
Next, we explore the rainout process and its duration in simulations that include mass loss, which we express in terms of the remaining envelope mass. We repeated the thermal evolution calculation for the same initial 10 M⊕ planet with different mass loss rates during the first 0.1 Gyr of their evolution. In Fig. 4 we present by the green line the rainout timescale as a function of the remaining H,He mass. As expected, the smaller the gas mass (the greater the mass loss) the faster the rainout. Interestingly, sub-Neptunes with H,He amounts exceeding 0.75 M⊕ are in the rainout phase for billions of years. They are thus characterized by inflated radii and polluted interiors. Gas-poor sub-Neptunes with less than 0.75 M⊕ of H,He “converge” to a core-envelope structure within less than 1 Gyr, resulting in fast (adiabatic) cooling and contraction in the post-rainout phase. However, planets with envelope masses larger than 0.3 M⊕ would look “younger” by their late released heat content for Gyrs, while planets with less than 0.3 M⊕ of H,He cool fast enough that their radius evolution coincides with the radius evolution of a similar planet that was born with a core-envelope structure in 1–2 Gyr. In that sense, rocky planets with less than 0.3 M⊕ H,He that formed with polluted envelopes cannot be distinguished from planets that formed with a core-envelope structure after ∼1 Gyr.
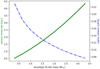 |
Fig. 4. Time from formation until convergence to a core-envelope structure (rainout timescale) as a function of envelope mass, shown in green. Trend is shown for sub-Neptune planets that contain 6.7 M⊕ of silicates and their gas (H,He) mass is determined by the mass loss rate, from 3.3 M⊕ (original model, no mass loss) down to 0.33 M⊕ (3 M⊕ mass loss). In blue, we show the maximum radius inflation by rainout in comparison to the core-envelope structure model at the rainout timescale. Curves are polynomial fits for the evolution data points. |
Faster rainout in planets with low mass envelopes causes stronger radius inflation, as a similar amount of energy is being released in a shorter time. Thus, the ∼8% radius inflation of a planet with massive (3.3 M⊕) envelope at age of 4.25 Gyr becomes 23% radius inflation in a planet with 0.33 M⊕ envelope at 0.55 Gyr. In Fig. 4 we present (with a dashed blue line) the trend of maximum radius inflation with remaining envelope mass. As can be seen, the earlier the rainout occurs the larger the radius inflation. The early, but stronger, radius inflation in planets with low H,He mass might enhance mass loss via photoevaporation, which depends on the planetary radius – if it overlaps with the strong XUV phase. The longer and moderate radius inflation in planets with significant H,He envelopes can be inferred, when using core-envelope model, as a larger H,He content.
4. Implications for exoplanets
The envelope (H,He) mass fraction of observed planets are usually derived from mass-radius relations, assuming a core-envelope structure (e.g., Lopez & Fortney 2014; Chen & Rogers 2016; Baraffe et al. 2008). However, when inflation by rainout operates the H,He fractions inferred for these planets in this way would be overestimated. To understand the significance of rainout, we examined a selection of planets in the exoplanet census with well defined masses, radii, and ages. Since the radii of these planets are more sensitive to their H,He fraction than to their planetary mass (Lopez & Fortney 2014), we extrapolated our results to slightly larger and smaller planets between 7 and 12 M⊕. For each exoplanet, we derived the core-envelope H,He fraction based on Lopez & Fortney (2014) for standard (solar) opacity. We then calculated the expected radius inflation by rainout at its age and used it to correct the radius and obtain a new H,He fraction, taking into account the rainout effect. Finally, we ran models with the new H,He fraction to verify their consistency with the observed parameters. As can be seen in Table 1, the actual H,He content can be half of the estimated by the standard model, when these planets formed with polluted envelopes.
Parameters of observed exoplanets (http://exoplanet.eu/) that we used as input parameters in the model and the resulting H,He fraction estimates for standard core-envelope models and for planets formed with polluted envelopes and rain out their silicates afterwards.
In Fig. 5 we show the mass–radius relation of observed exoplanets, and mark (in green) the planets that we model and are potentially affected by the rainout, either by post-rainout radius inflation or because they are still raining-out their polluted envelopes. Planets with radii smaller than 3.3 R⊕ have less than 5% H,He; thus, the rainout effect after 1 Gyr is negligible. Sub-Neptunes with radii above 3.3 R⊕ may have underestimated metal content if rainout effect on the radius is ignored (as shown in Table 1). Planets above 3.3 R⊕ that are not marked in green do not have well-defined age estimates and, therefore, they cannot be interpreted by our model.
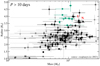 |
Fig. 5. Mass–radius relation of observed exoplanets. Planets in green are potentially inflated by past or ongoing rainout, in comparison to planets that formed with core-envelope structures. The rainout effect on the inferred H,He mass of the marked exoplanets is shown in Table 1. The sub-Neptune planets with radii above 3.3 R⊕ that aren’t marked in green lack an age measurement and are thus not included in our analysis. Planets with radii below 3.3 M⊕ are consistent with low (< 5%) H,He and thus rainout has negligible effect on radius at Gyrs age. |
Rainout takes place on ∼Gyr timescales, making the age of the planet an important parameter in determining its planetary structure. As can be seen in Table 1, younger sub-Neptunes are prone to larger rainout effects. Since sub-Neptunes rain out on billion-year timescales, which is the age of most of the observed exoplanets, knowing their age will help us to better constrain the interior structure of individual observed planets. As of today, many sub-Neptune planets do not have well-defined age measurements. Future measurements of stellar age will allow us to suggest corrected H,He fractions for these planets in cases where they formed with polluted envelopes. Moreover, large enough statistical database of radius and age will allow us to examine trends in radius evolution that may hint towards formation mechanisms of sub-Neptunes. For example, planets formed with polluted envelopes will feature a spread in radius during their early evolution that is larger than expected by standard adiabatic cooling. Planets may display a typical radius diversity for a specific range of H,He mass content. In this context, the expected data from the PLATO mission (Rauer et al. 2014) on stellar age is expected to drive a significant improvement in our understanding of planets evolution in general – and, specifically, of planets formed with polluted envelopes and on the rainout process.
Another observational implication is the possible overlap of the rainout phase with the period of high-energy irradiation by the young star. Since mass loss by photoevaporation strongly depends on planetary radius (third power, Owen & Wu 2016), planets with low-mass envelopes and, thus, early rainout and large radius inflation, are prone to enhanced “sedimentation-powered” mass loss. As we have found, a 7 M⊕ sub-Neptune planet with 5% H,He content will suffer radius inflation of up to 23%, within the first 0.5 Gyr, which might double the expected mass loss by photoevaporation at early time. Thus, planets with less than 0.3 M⊕ may experience a “sedimentation-powered” mass loss of their primordial hydrogen atmospheres. A detailed calculation of the effect of radius inflation on mass loss will be discussed in a companion study (Vazan et al., in prep.).
5. Conclusions
In this work we find that rainout of high-Z vapor significantly affects the evolution of sub-Neptunes born with polluted envelopes as it can operate on evolutionary (∼Gyr) timescales. The timescales we find in this work are still shorter than those established in Brouwers & Ormel (2020), who estimated a 10 Gyr rainout time for super-Earth planets with a few percent H,He. The longer timescale found in their work is probably the result of relying on the ideal gas equation of state, which usually suffers from overly high temperatures for the same conditions (see Ormel et al. 2021, for an equation-of-state comparison).
The key findings from this study are as follows.
-
Sub-Neptune planets formed with polluted envelopes experience late growth of a rocky core due to rainout of high-Z vapor. The timescale for rainout depends on envelope mass.
-
The interior structure of a rocky sub-Neptune formed by pebble accretion depends on its envelope’s (H,He) mass and age. Planets with less than 0.75 M⊕ H,He evolve towards a core-envelope structure by 1 Gyr, while planets with more massive envelopes or younger planets may still be raining-out when we observe them, and thus have interiors with composition gradients and/or polluted envelopes.
-
Rocky planets with less than 0.3 M⊕ H,He that formed with polluted envelopes cannot be distinguished from planets that formed with a core-envelope structure after about 1 Gyr, due to short rainout phase and efficient cooling.
-
The rainout process causes radius inflation by release of gravitational energy (settling), latent heat (condensation), and formation energy (composition gradient erosion). The radius inflation is shorter and larger in planets with low mass envelopes: a few percent for sub-Neptunes with massive gas envelope and larger (a few tens of percent), but on much shorter timescale in planets with lower gas mass fractions.
-
Planets that formed with polluted envelopes would look “younger” than planets that formed with core-envelope structure, as a result of the later heat release. Alternatively, if the age is known, the inflated radii might be interpreted as higher H,He mass in these planets, which can be up to twice of the actual value.
The model in this Letter is dedicated to rocky sub-Neptunes, formed as 10 M⊕ planets – with and without envelope mass loss. Significantly more (less) massive planets have stronger (weaker) gravity fields, which will affect the results quantitatively. In a companion paper (Vazan et al., in prep.) we carry out a parameter space study for a wider range of masses and formation parameters.
The model of rocky plant with a polluted envelope but no rainout is unrealistic, so it is shown here only to emphasize the rainout effect on radius evolution.
Acknowledgments
We thank the referee for constructive comments that improved the manuscript. A.V. acknowledges support by ISF grants 770/21 and 773/21. C.W.O. acknowledge support by the National Natural Science Foundation of China (grant no. 12250610189). Figures were plotted using Matplotlib (Hunter 2007).
References
- Baraffe, I., Chabrier, G., & Barman, T. 2008, A&A, 482, 315 [NASA ADS] [CrossRef] [EDP Sciences] [Google Scholar]
- Bodenheimer, P., Stevenson, D. J., Lissauer, J. J., & D’Angelo, G. 2018, ApJ, 868, 138 [NASA ADS] [CrossRef] [Google Scholar]
- Brouwers, M. G., & Ormel, C. W. 2020, A&A, 634, A15 [Google Scholar]
- Brouwers, M. G., Vazan, A., & Ormel, C. W. 2018, A&A, 611, A65 [NASA ADS] [CrossRef] [EDP Sciences] [Google Scholar]
- Brouwers, M. G., Ormel, C. W., Bonsor, A., & Vazan, A. 2021, A&A, 653, A103 [NASA ADS] [CrossRef] [EDP Sciences] [Google Scholar]
- Chen, H., & Rogers, L. A. 2016, ApJ, 831, 180 [Google Scholar]
- Faik, S., Tauschwitz, A., & Iosilevskiy, I. 2018, Comput. Phys. Commun., 227, 117 [NASA ADS] [CrossRef] [Google Scholar]
- Freedman, R. S., Lustig-Yaeger, J., Fortney, J. J., et al. 2014, ApJS, 214, 25 [CrossRef] [Google Scholar]
- Fulton, B. J., Petigura, E. A., Howard, A. W., et al. 2017, AJ, 154, 109 [Google Scholar]
- Guillot, T. 1995, Science, 269, 1697 [CrossRef] [Google Scholar]
- Gupta, A., & Schlichting, H. E. 2020, MNRAS, 493, 792 [Google Scholar]
- Hunter, J. D. 2007, Comput. Sci. Eng., 9, 90 [NASA ADS] [CrossRef] [Google Scholar]
- King, G. W., & Wheatley, P. J. 2021, MNRAS, 501, L28 [Google Scholar]
- Kraus, R. G., Stewart, S. T., Swift, D. C., et al. 2012, J. Geophys. Res. (Planets), 117, E09009 [Google Scholar]
- Kubyshkina, D., & Fossati, L. 2022, A&A, 668, A178 [NASA ADS] [CrossRef] [EDP Sciences] [Google Scholar]
- Leconte, J., Selsis, F., Hersant, F., & Guillot, T. 2017, A&A, 598, A98 [NASA ADS] [CrossRef] [EDP Sciences] [Google Scholar]
- Lee, E. J., & Chiang, E. 2015, ApJ, 811, 41 [Google Scholar]
- Lopez, E. D., & Fortney, J. J. 2014, ApJ, 792, 1 [Google Scholar]
- Lopez, E. D., Fortney, J. J., & Miller, N. 2012, ApJ, 761, 59 [Google Scholar]
- Markham, S., Guillot, T., & Stevenson, D. 2022, A&A, 665, A12 [NASA ADS] [CrossRef] [EDP Sciences] [Google Scholar]
- Misener, W., & Schlichting, H. E. 2022, MNRAS, 514, 6025 [CrossRef] [Google Scholar]
- Mordasini, C. 2014, A&A, 572, A118 [NASA ADS] [CrossRef] [EDP Sciences] [Google Scholar]
- Mordasini, C. 2020, A&A, 638, A52 [NASA ADS] [CrossRef] [EDP Sciences] [Google Scholar]
- Movshovitz, N., Bodenheimer, P., Podolak, M., & Lissauer, J. J. 2010, Icarus, 209, 616 [Google Scholar]
- Ormel, C. W. 2014, ApJ, 789, L18 [Google Scholar]
- Ormel, C. W., Vazan, A., & Brouwers, M. G. 2021, A&A, 647, A175 [NASA ADS] [CrossRef] [EDP Sciences] [Google Scholar]
- Owen, J. E., & Wu, Y. 2013, ApJ, 775, 105 [Google Scholar]
- Owen, J. E., & Wu, Y. 2016, ApJ, 817, 107 [NASA ADS] [CrossRef] [Google Scholar]
- Rafikov, R. R. 2006, ApJ, 648, 666 [Google Scholar]
- Rauer, H., Catala, C., Aerts, C., et al. 2014, Exp. Astron., 38, 249 [Google Scholar]
- Rogers, J. G., & Owen, J. E. 2021, MNRAS, 503, 1526 [NASA ADS] [CrossRef] [Google Scholar]
- Saumon, D., Chabrier, G., & van Horn, H. M. 1995, ApJS, 99, 713 [NASA ADS] [CrossRef] [Google Scholar]
- Stevenson, D. J., Bodenheimer, P., Lissauer, J. J., & D’Angelo, G. 2022, PSJ, 3, 74 [NASA ADS] [Google Scholar]
- Vazan, A., Kovetz, A., Podolak, M., & Helled, R. 2013, MNRAS, 434, 3283 [NASA ADS] [CrossRef] [Google Scholar]
- Vazan, A., Helled, R., Kovetz, A., & Podolak, M. 2015, ApJ, 803, 32 [NASA ADS] [CrossRef] [Google Scholar]
- Vazan, A., Ormel, C. W., Noack, L., & Dominik, C. 2018, ApJ, 869, 163 [NASA ADS] [CrossRef] [Google Scholar]
- Vazan, A., Sari, R., & Kessel, R. 2022, ApJ, 926, 150 [NASA ADS] [CrossRef] [Google Scholar]
Appendix A: Planet formation model
The input model we use for the evolution is the outcome of the planet formation model of Ormel et al. (2021), which calculates the growth of the core and envelope of an embedded, pebble-accreting planet. The envelope is assumed to be in hydrostatic equilibrium on dynamical timescales and in pressure equilibrium with the surrounding disk gas. At each time step, a steady solution to the stellar structure equations is found. A key element in the model is the relaxation of the standard assumption that accreting solids end up in the core.
The formation calculation assumes constant solid accretion rate of 10−5 M⊕ yr−1. The effects of pebble accretion on gas accretion are included via acceleration of gas accretion through accumulation of a vapor-rich atmosphere, and by contribution to the opacity, which reduces the intake of nebular gas. The formation model uses tabular equation of states of H,He and SiO2 and their mixtures, based on Vazan et al. (2013). The vaporization is determined by the silicate liquid-vapor (saturation) curve of Kraus et al. (2012).
In Fig. A.1 we show the initial model we use in this work. The model is identical to what appears in the middle-bottom panel of Fig. 13 in Ormel et al. (2021). It is the outcome of the growth of a planet embedded in the protoplanetary disk at 0.2 AU, starting from an embryo of 0.06 M⊕ and proceeding to the point where 10 M⊕ mass is reached after about 5 Myr. The solid core in the planet formation model is not part of the interior grid and is modeled by constant density and arbitrary temperature. These input density and temperature profiles converge to isentropic profiles after the initial procedure in the evolution model, in which realistic equation of state and structure equations are applied also to the core.
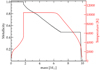 |
Fig. A.1. Initial model we use for the evolution calculations, resulting from planet formation model of Ormel et al. (2021). Metallicity (black) and temperature (red) profiles for a planet formed by rocky pebble accretion at 0.2 AU. The temperature in the classical core region that is not modeled in the formation model, is fitted by isentropic profile in the evolution model. See text for details. |
The end of the planetary formation phase is chosen at the state where the planet mass reached 10 M⊕. As expected, if the simulation is allowed to continue in gas-rich vicinity the planet would reach the crossover point and start its runaway gas accretion. Nevertheless, pre-runaway evolutionary timescales typically slow down (e.g., Rafikov 2006; Lee & Chiang 2015; Ormel et al. 2021, Fig. 6), ultimately making the formation of such 10 M⊕ planet with a significant H,He envelope conceivable.
Appendix B: Rainout versus radius and pressure
The data shown in Fig. 2 as a function of the code’s mass grid (y-axis) may give the impression that rainout takes place in the outer atmosphere. We therefore plotted the same data also as a function of radius (Fig. B.1) and pressure (Fig. B.2) in the y-axis. Solid lines indicate values of Z = 0.02 and Z = 0.98. As can be seen in the two figures, the envelope pollution (evaporation front) is located in the deep interior at pressure > 0.1 GPa, at about half of the total radius. While rainout takes place deep in the envelope, the outer envelope (and atmosphere) are left almost silicate-free and, thus, more prone to inflation by the rainout heat release.
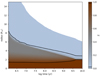 |
Fig. B.1. Same data as in Fig. 2, shown here as a function of radius instead of mass (y axis). Silicate mass fraction (color) ranges between zero (gas only) in blue and pure silicate in brown. White area is empty, due to radius contraction. |
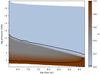 |
Fig. B.2. Same data as in Figs. 2 and B.1, shown here as a function of pressure (y axis). Silicate mass fraction (color) ranges between zero (gas only) in blue and pure silicate in brown. White areas are empty, due to pressure increase in contraction. |
All Tables
Parameters of observed exoplanets (http://exoplanet.eu/) that we used as input parameters in the model and the resulting H,He fraction estimates for standard core-envelope models and for planets formed with polluted envelopes and rain out their silicates afterwards.
All Figures
|
Fig. 1. Silicate mass fraction (left) and temperature profile (right) of a 10 M⊕ sub-Neptune with 33% H,He located at 0.2 AU. Profiles are shown at different evolution phases. See Appendix A for more details on the initial (planet formation) profiles. |
| In the text | |
|
Fig. 2. Silicate mass fraction (color) as a function of interior layers (y axis) and time (x axis). Silicate mass fraction ranges between zero (gas only) in blue and pure silicate in brown. The gradual distribution of silicate from formation converges into a core-envelope structure after about 4.25 Gyr. The solid lines signify Z = 0.98 and Z = 0.02 enrichment levels. Versions of this figure for radius and pressure layers instead of mass are presented in Appendix B. |
| In the text | |
|
Fig. 3. Radius (left) and luminosity (right) evolution of the 10 M⊕ planet shown in Figs. 1 and 2 (red). The evolution of same planets without rainout (dashed black) and with core-envelope structure from formation (solid black) are shown for comparison. The green vertical line signifies the end of the rainout phase. Radius inflation at that point is 7.8% in comparison to the core-envelope case. |
| In the text | |
|
Fig. 4. Time from formation until convergence to a core-envelope structure (rainout timescale) as a function of envelope mass, shown in green. Trend is shown for sub-Neptune planets that contain 6.7 M⊕ of silicates and their gas (H,He) mass is determined by the mass loss rate, from 3.3 M⊕ (original model, no mass loss) down to 0.33 M⊕ (3 M⊕ mass loss). In blue, we show the maximum radius inflation by rainout in comparison to the core-envelope structure model at the rainout timescale. Curves are polynomial fits for the evolution data points. |
| In the text | |
|
Fig. 5. Mass–radius relation of observed exoplanets. Planets in green are potentially inflated by past or ongoing rainout, in comparison to planets that formed with core-envelope structures. The rainout effect on the inferred H,He mass of the marked exoplanets is shown in Table 1. The sub-Neptune planets with radii above 3.3 R⊕ that aren’t marked in green lack an age measurement and are thus not included in our analysis. Planets with radii below 3.3 M⊕ are consistent with low (< 5%) H,He and thus rainout has negligible effect on radius at Gyrs age. |
| In the text | |
|
Fig. A.1. Initial model we use for the evolution calculations, resulting from planet formation model of Ormel et al. (2021). Metallicity (black) and temperature (red) profiles for a planet formed by rocky pebble accretion at 0.2 AU. The temperature in the classical core region that is not modeled in the formation model, is fitted by isentropic profile in the evolution model. See text for details. |
| In the text | |
|
Fig. B.1. Same data as in Fig. 2, shown here as a function of radius instead of mass (y axis). Silicate mass fraction (color) ranges between zero (gas only) in blue and pure silicate in brown. White area is empty, due to radius contraction. |
| In the text | |
|
Fig. B.2. Same data as in Figs. 2 and B.1, shown here as a function of pressure (y axis). Silicate mass fraction (color) ranges between zero (gas only) in blue and pure silicate in brown. White areas are empty, due to pressure increase in contraction. |
| In the text | |
Current usage metrics show cumulative count of Article Views (full-text article views including HTML views, PDF and ePub downloads, according to the available data) and Abstracts Views on Vision4Press platform.
Data correspond to usage on the plateform after 2015. The current usage metrics is available 48-96 hours after online publication and is updated daily on week days.
Initial download of the metrics may take a while.