Fig. 8
Download original image
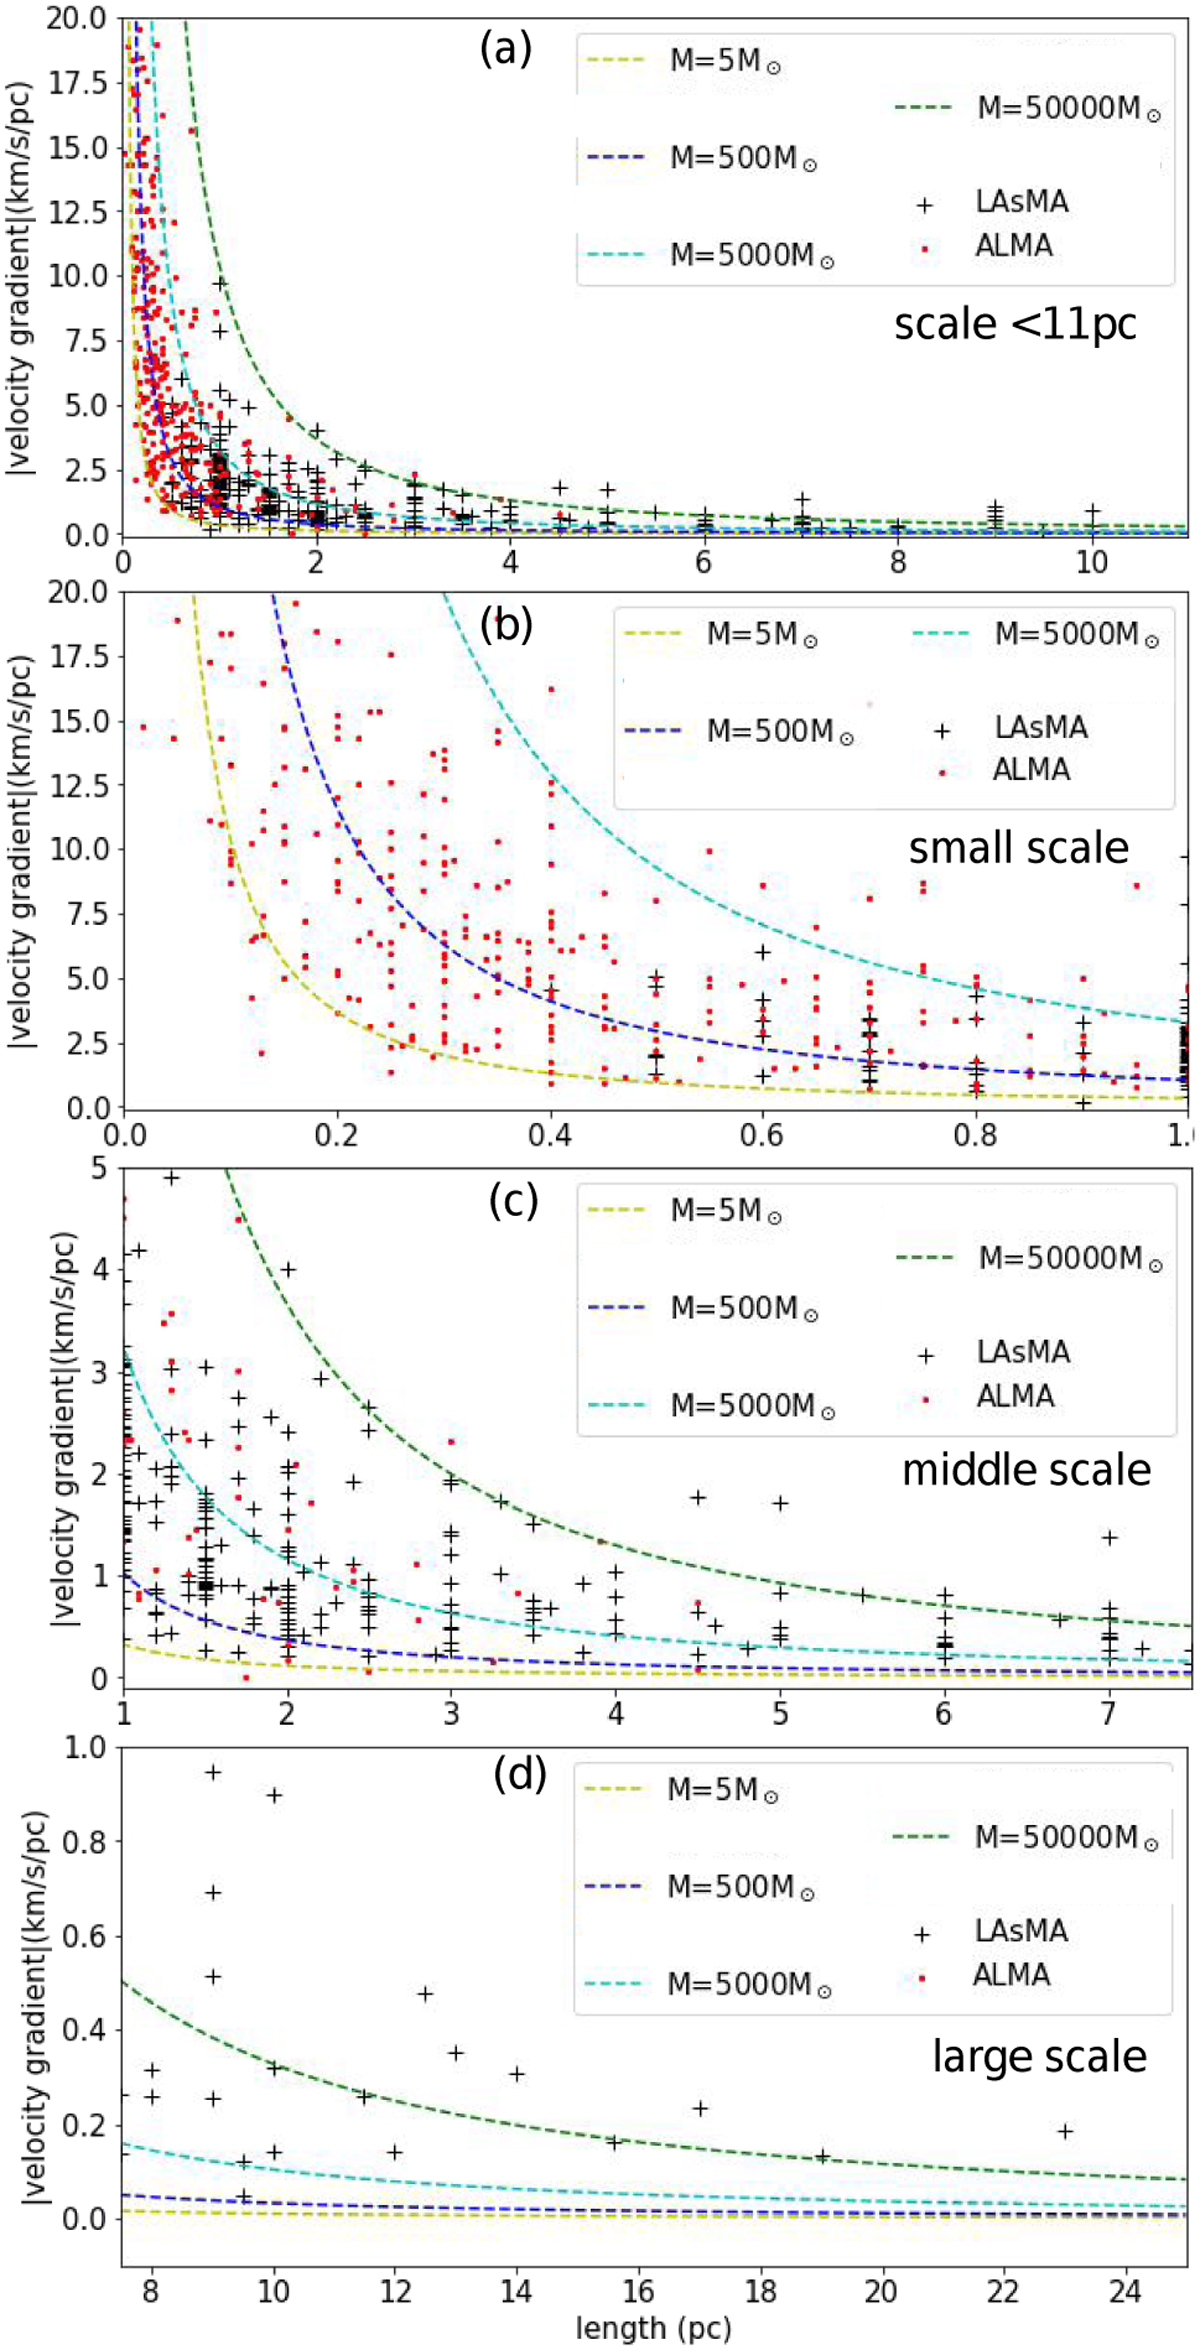
Statistical analysis of all fitted velocity gradients. (a): Velocity gradient vs. the length over which the gradient has been estimated for all sources in the ATOMS survey (red dots) and current LAsMA observation (black plus). The color lines show the freefall velocity gradients for comparison. For the freefall model, yellow, blue, cyan, and green lines denote masses of 5 M⊙, 500 M⊙, 5000 M⊙, and 50 000 M⊙, respectively. Panels b–d: zoomed maps with lengths <1 pc (small scale), ~ 1–7.5 pc (medium scale), and >7.5 pc (large scale) in panel a.
Current usage metrics show cumulative count of Article Views (full-text article views including HTML views, PDF and ePub downloads, according to the available data) and Abstracts Views on Vision4Press platform.
Data correspond to usage on the plateform after 2015. The current usage metrics is available 48-96 hours after online publication and is updated daily on week days.
Initial download of the metrics may take a while.