Fig. 7
Download original image
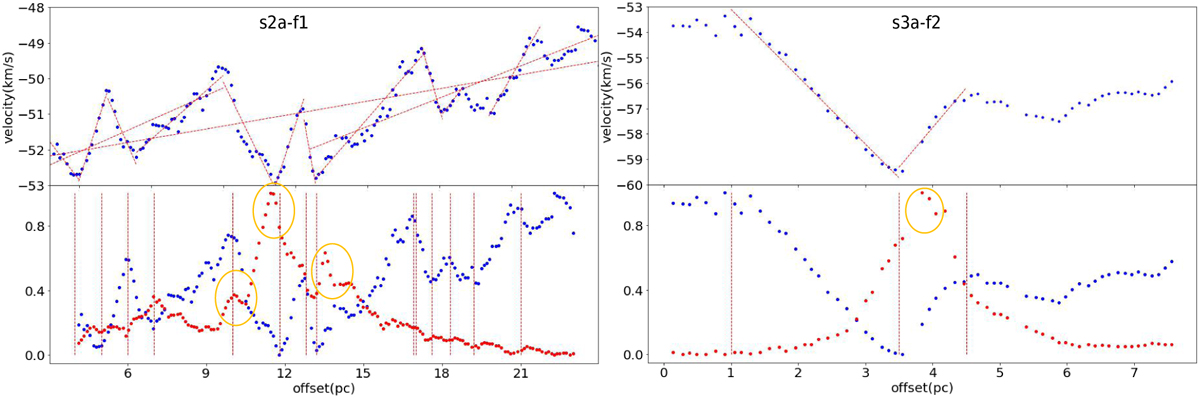
Two selected filaments illustrate the fitting of the velocity gradient. Upper panels: velocity gradients are fit in the ranges defined by the vertical dashed red lines, and straight lines show the linear fitting results. Lower panels: dotted blue and red lines show the normalized velocity and intensity, respectively. The orange circles mark the intensity peaks of 13CO (3–2) emission associated with ATLASGAL clumps. For other filaments, see Figs. A.4–A.8.
Current usage metrics show cumulative count of Article Views (full-text article views including HTML views, PDF and ePub downloads, according to the available data) and Abstracts Views on Vision4Press platform.
Data correspond to usage on the plateform after 2015. The current usage metrics is available 48-96 hours after online publication and is updated daily on week days.
Initial download of the metrics may take a while.