Open Access
Fig. 5
Download original image
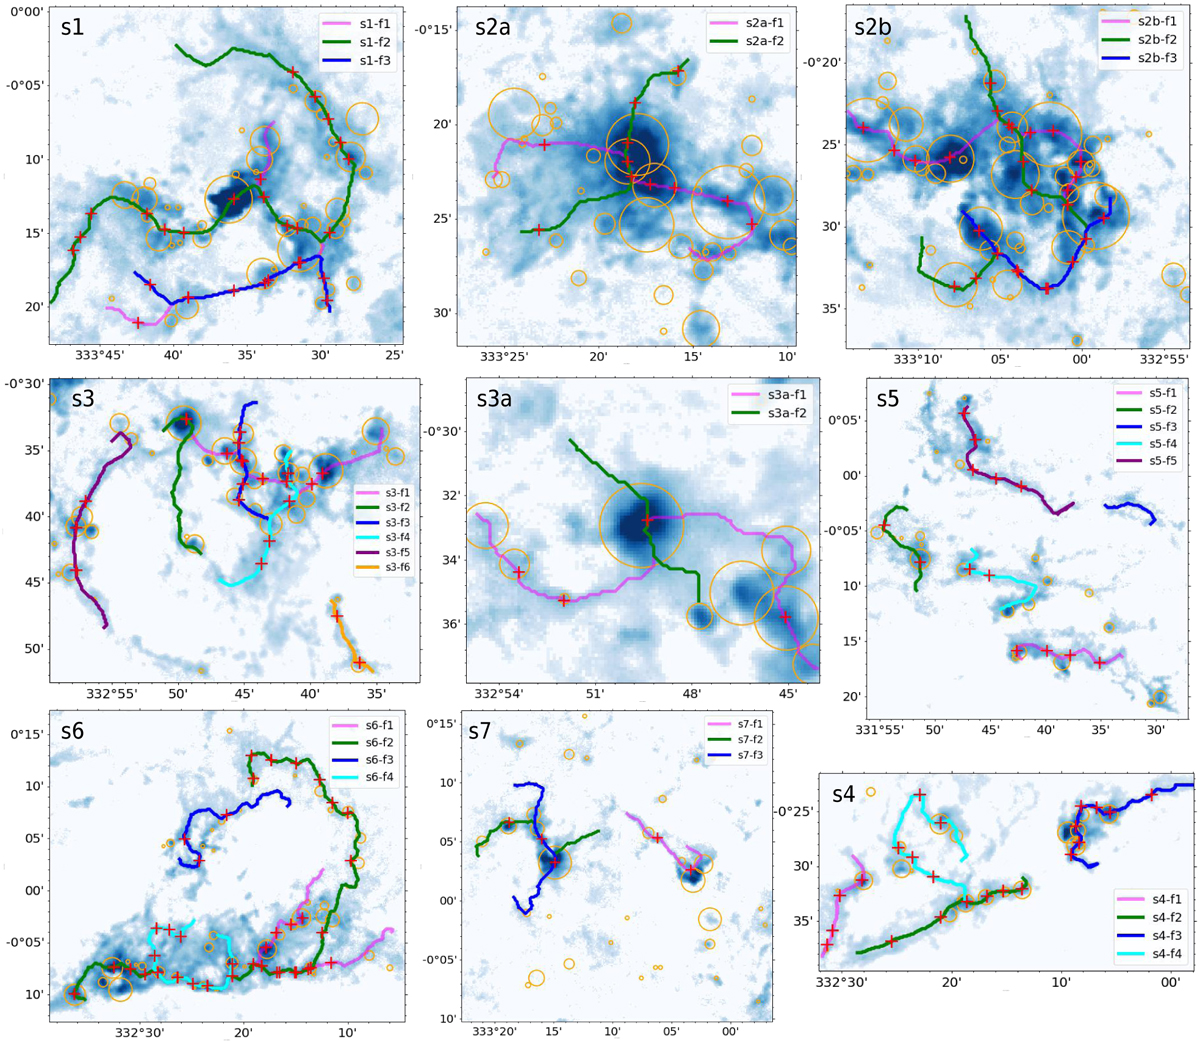
Background images showing the moment-zero maps of 13CO (3–2). The lines in color present the filament skeletons. The orange circles show the ATLASGAL clumps. The size of the circle represents the clump radius. The red plus marks the intensity peak of 13CO (3–2) emission in Fig. 7.
Current usage metrics show cumulative count of Article Views (full-text article views including HTML views, PDF and ePub downloads, according to the available data) and Abstracts Views on Vision4Press platform.
Data correspond to usage on the plateform after 2015. The current usage metrics is available 48-96 hours after online publication and is updated daily on week days.
Initial download of the metrics may take a while.