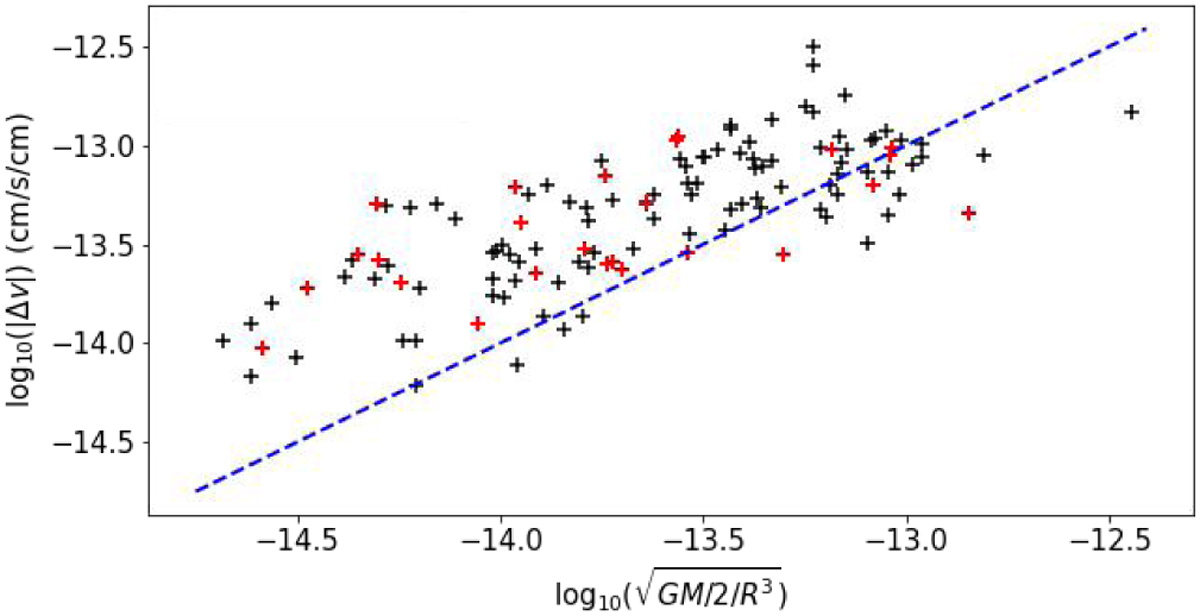
Fig. 11
Download original image
Correlation between the left and right terms in Eq. (1) revealed by the values of M, L, and ∇V listed in Tables 1 and 2. The dotted blue line is the line of equality of the left and right terms. Tables 1 and show two cases. A dense clump with two or more filaments leading to it, or only one filament with a gradient that can be identified (the rows with only one entry for the gradient). The number of clumps in the two cases is 49 and 25, and they marked by black and red plus, respectively.
Current usage metrics show cumulative count of Article Views (full-text article views including HTML views, PDF and ePub downloads, according to the available data) and Abstracts Views on Vision4Press platform.
Data correspond to usage on the plateform after 2015. The current usage metrics is available 48-96 hours after online publication and is updated daily on week days.
Initial download of the metrics may take a while.