Fig. 1
Download original image
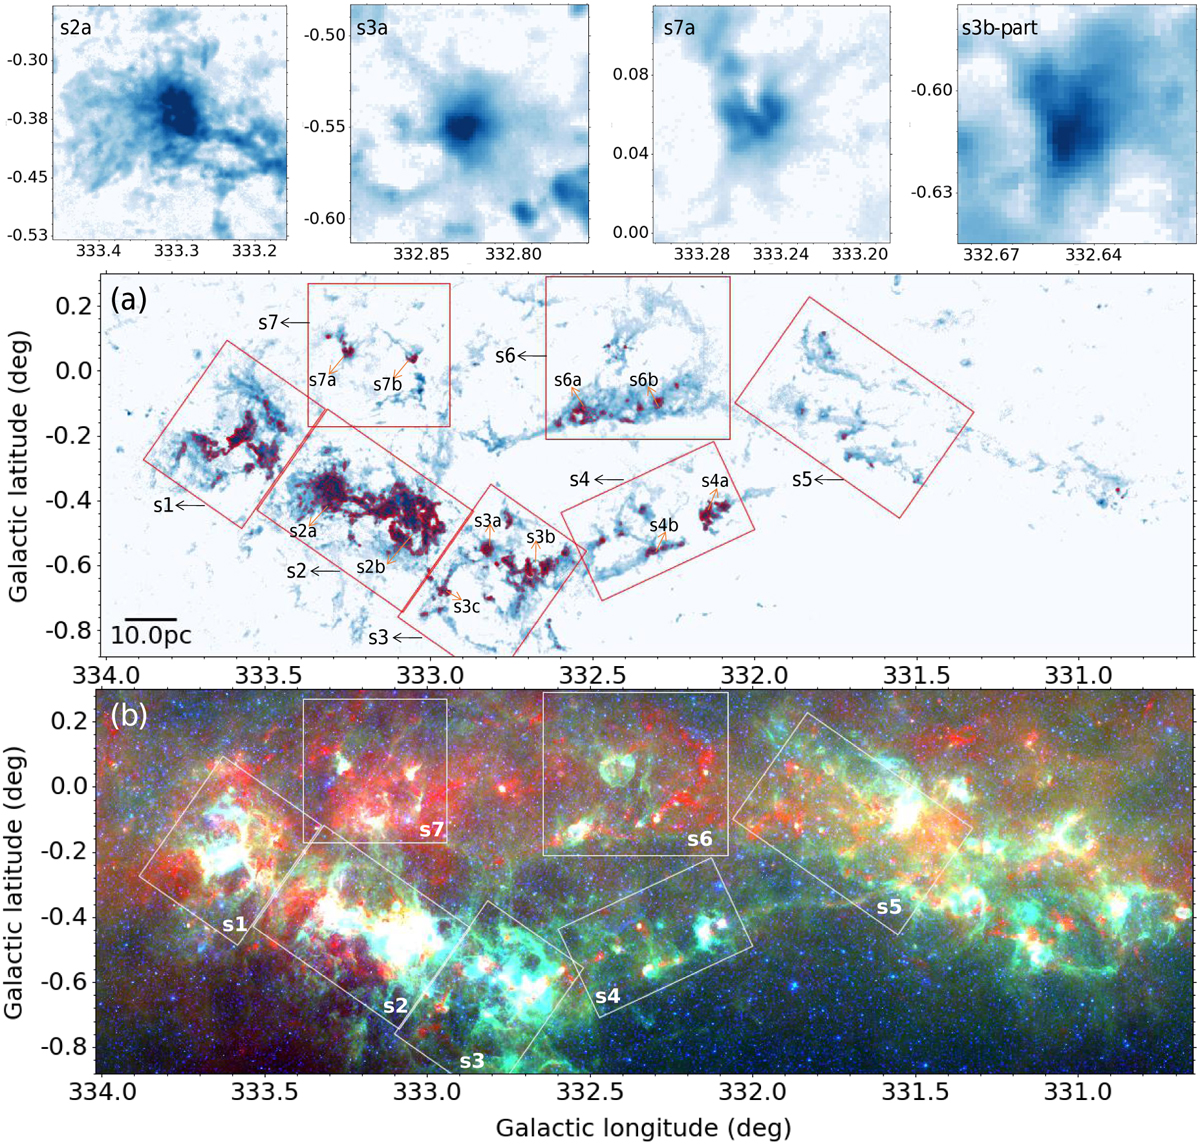
Overview of the entire observed field. The enlarged maps in the first row display several typical hub-filament structures. (a): The background is the integrated intensity map of 13CO (3–2) for the G333 complex, and the boxes show several divided subregions. The letters indicate the substructures studied in this work. The red contours show the peak emission of 13CO (3–2). (b): Overview three-color map of the observed field by combining ATLASGAL+Planck 870 µm (red) and GLIMPSE 8.0 (green) and 4.5 µm (blue) emission, including the G333 complex and GMC G331.
Current usage metrics show cumulative count of Article Views (full-text article views including HTML views, PDF and ePub downloads, according to the available data) and Abstracts Views on Vision4Press platform.
Data correspond to usage on the plateform after 2015. The current usage metrics is available 48-96 hours after online publication and is updated daily on week days.
Initial download of the metrics may take a while.