| Issue |
A&A
Volume 676, August 2023
|
|
|---|---|---|
| Article Number | A7 | |
| Number of page(s) | 8 | |
| Section | Stellar structure and evolution | |
| DOI | https://doi.org/10.1051/0004-6361/202346420 | |
| Published online | 26 July 2023 | |
New X-ray detections of magnetic period-bounce cataclysmic variables from XMM-Newton and SRG/eROSITA
1
Institut für Astronomie und Astrophysik, Eberhard-Karls Universität Tübingen, Sand 1, 72076 Tübingen, Germany
e-mail: This email address is being protected from spambots. You need JavaScript enabled to view it.
2
INAF – Osservatorio Astronomico di Palermo, Piazza del Parlamento 1, 90134 Palermo, Italy
3
INAF – Osservatorio Astronomico di Capodimonte, Via Moiariello 16, 80131 Naples, Italy
4
Leibniz-Institut für Astrophysik Potsdam (AIP), An der Sternwarte 16, 14482 Potsdam, Germany
Received:
13
March
2023
Accepted:
7
June
2023
Abstract
Context. A great portion of the cataclysmic variable population, between 40% and 70%, is predicted to be made up of period-bouncers, systems with degenerate donors that have evolved past the period minimum. However, due to their intrinsic faintness, only a few of these systems have been observed and confidently identified so far.
Aims. We have searched for X-ray emission as proof of accretion in order to confirm period-bounce cataclysmic variables.
Methods. In this study, we used data from XMM-Newton and eROSITA on a pilot sample of three period-bounce candidates with a magnetic white dwarf, which are expected to exhibit stronger X-ray emission than non-magnetic systems due to more efficient conversion of matter accretion onto the white dwarf.
Results. In a dedicated XMM-Newton observation of the period-bounce candidate SDSS J151415.65+074446.5 we discovered X-ray modulation at the binary orbital period confirming it as an accreting system. The X-ray light curve and the X-ray spectrum display characteristics of magnetic Polar-type systems, allowing us for the first time to determine the X-ray luminosity and mass accretion rate for this system. Catalog data from eROSITA on the Spektrum-Roentgen-Gamma satellite for V379 Vir and SDSS J125044.42+154957.4 enabled a first look into the X-ray behavior of period-bounce candidates with this new all-sky instrument. From the eROSITA measurements, the X-ray luminosity and mass accretion rate were determined for the first time for SDSS J125044.42+154957.4, and the earlier result for V379 Vir from XMM-Newton was confirmed.
Conclusions. The three cataclysmic variables with a magnetic white dwarf and very low-mass donor studied in this work present evidence for X-ray emission at a similar level of LX [erg s−1] ≈ 1029, which, together with the detection of X-ray orbital modulation in two of them (i.e., V379 Vir and SDSS J151415.65+074446.5), unambiguously proves the presence of accretion in these systems. The detection of these period-bouncers at faint X-ray luminosity levels with the all-sky X-ray survey eROSITA offers new prospects for the identification of additional period-bouncers, providing impetus for theoretical studies of binary evolution.
Key words: X-rays: binaries / stars: individual: SDSS J151415.65+074446.5 / stars: individual: SDSS J121209.31+013627.7 / stars: individual: SDSS J125044.42+154957.4
© The Authors 2023
 Open Access article, published by EDP Sciences, under the terms of the Creative Commons Attribution License (https://creativecommons.org/licenses/by/4.0), which permits unrestricted use, distribution, and reproduction in any medium, provided the original work is properly cited.
This article is published in open access under the Subscribe to Open model. This email address is being protected from spambots. You need JavaScript enabled to view it. to support open access publication.
1. Introduction
Cataclysmic variables (CVs) are interacting compact binaries where a white dwarf (WD) accretes matter from a Roche-lobe filling late-type donor (Warner 1995). Two main types of CVs have been distinguished according to the accretion geometry of the system in question. Usually, accretion onto the WD occurs via a disk, but if the WD magnetic field is strong enough (≳10 MG), the formation of an accretion disk is prevented and accretion flow proceeds directly from the companion toward the magnetic polar regions. In these high-field systems, called Polars, the WD rotation is phase locked at the orbital period (Cropper 1990). Polars are known to switch between high and low mass-accretion rate states spending roughly half their time in low states, as seen in the case of the prototype AM Her (Hessman et al. 2000), making their identification and characterization challenging (Pretorius et al. 2013).
In terms of evolution, all CVs follow a track from longer orbital periods toward shorter ones driven by angular momentum loss, which causes the orbital separation of the system to decrease (Knigge et al. 2011). In the course of this evolution, the system passes through a period gap as a detached binary between an orbital period (Porb) of 2–3 h, and reemerges as an active CV when the donor is again filling its Roche lobe (Howell et al. 2001). Through angular momentum loss due to gravitational radiation, the evolution continues toward even shorter periods until the system reaches a period minimum located at an orbital period of Pmin ≈ 80 min (see e.g., Howell et al. 2001; Patterson 2011; Pretorius et al. 2013; Goliasch & Nelson 2015; McAllister et al. 2019; Pala et al. 2020, 2022). At the period minimum, the donor is out of thermal equilibrium because its mass-loss timescale is much shorter than its thermal timescale, causing the donor to stop shrinking in response to mass loss (King 1988). This results in the increase of the system’s orbital separation and consequently the CV bouncing back to longer orbital periods. These systems are dubbed “period-bouncers” (Patterson 1998). The actual contribution from period-bouncers to the total CV population is highly disputed, with estimations ranging between 40% and 70% and depending heavily on the formation and evolution model used as well as the assumptions made about the system’s parameters (see e.g., Schreiber et al. 2015; Belloni et al. 2020; Pala et al. 2020). However, as a matter of fact, only a small number of period-bouncers and candidates have been observed and identified, mainly from the Sloan Digital Sky Survey (SDSS; Gänsicke et al. 2009; Littlefair et al. 2008), and a few of them have been shown to harbor a magnetic WD that possibly accretes at low rates (see e.g., Schmidt et al. 2005; Breedt et al. 2012).
The very low-mass donors (late M and L dwarfs) of period-bouncers have either no coronal X-ray emission or emission that is extremely weak and hardly detectable with present-day instrumentation (Audard et al. 2007; De Luca et al. 2020). Therefore, the detection of X-ray emission is a key diagnostic of ongoing mass accretion in the system, and hence it is the most promising path for the identification of period-bouncers. Another method for detecting mass accretion relies on the presence of Hα emission. However, contrary to X-rays, this is not a reliable diagnostic of mass accretion in binaries with M or L dwarfs, since only upper limits to the mass accretion rate (Ṁacc) can be obtained due to the possible contribution of the donor’s chromospheric activity or its irradiation by the WD.
Candidate period-bouncers can also be identified through an excess of emission in the infrared spectrum over the WD contribution. Such emission could be produced by a very late-type donor, one of the key characteristics of these systems. Since CVs with a magnetic WD typically show a higher ratio between X-ray flux and optical flux, and thus higher X-ray luminosity, as they do not present a disk through which accretion luminosity is dissipated, we narrowed our search for period-bounce candidates to binaries composed by a magnetic WD with evidence for a very late-type companion. Of the few binaries where the presence of a very late-type companion has been spectroscopically confirmed, so far four have a magnetic WD. This includes EF Eri and V379 Vir (also known as SDSS J121209.31+013627.7), which were each detected as an X-ray source by White (1981) and Burleigh et al. (2006), respectively, as well as the two siblings of V379 Vir, SDSS J125044.42+154957.4 and SDSS J151415.65+074446.4 (henceforth SDSS 1250 and SDSS 1514), which have no X-ray emission reported in the literature. The nature of EF Eri is, presently, still unclear. Its orbital period locates EF Eri near the Pmin for CVs, but the presence of a degenerate donor in the system is still debated. Schwope & Christensen (2010) favored a degenerate donor based on its estimated J-band brightness and the semi-empirical donor sequence of Knigge (2006). However, with Gaia Data Release 3 (DR3), the distance to EF Eri was revised to a much larger value, increasing the estimated absolute magnitude of the donor to above the substellar limit and thus weakening the arguments for a degenerate donor in the system.
Stelzer et al. (2017) detected X-ray orbital modulation on V379 Vir from a deep XMM-Newton observation, proving that the system is accreting and thus confirming it as a period-bounce system of the Polar type. Through modeling of the X-ray light curve, Stelzer et al. (2017) derived an X-ray luminosity of ∼3 × 1029 erg s−1 that, assuming a mass of 0.8 M⊙ and a radius of 7 × 108 cm for the WD, yields a mass accretion rate in the system of 3.2 × 10⁻¹⁴ M⊙ yr−1. The estimated value for the wind-driven mass accretion rate in this system is orders of magnitude too weak to explain the observed accretion rate and therefore is most likely not the accretion mechanism in the system. Additionally, donor stars in CVs are typically oversized as they are driven out of thermal equilibrium due to mass transfer (Knigge et al. 2011), making Roche-lobe overflow the most likely accretion mechanism.
However, whether V379 Vir is a typical magnetic period-bouncer rather than a peculiar system still has to be demonstrated. To this end, we study the X-ray emission of systems SDSS 1250 and SDSS 1514, as they are composed of similar stellar components, namely a cool (∼10 000 K) DA magnetic WD with a very low-mass companion (late M or L estimated spectral type). Neither of the systems has been previously detected in X-ray surveys. We used XMM-Newton with its European Photon Imaging Camera (EPIC) pn detector, which offers the largest collecting area among existing X-ray instruments.
Most of the confirmed detections of period-bouncers (see e.g., Patterson et al. 2005; McAllister et al. 2017; Neustroev et al. 2017; Pala et al. 2018; Schwope et al. 2021; Amantayeva et al. 2021; Kawka et al. 2021; Neustroev & Mäntynen 2023) have occurred through detailed observations of specific sources using different instruments in the X-ray, optical, and/or infrared bands. As a result, the sample of period-bouncers with complete and reliable system parameters is quite small and may not be representative of the period-bouncers as a class. With the launch of the extended ROentgen Survey with an Imaging Telescope Array (eROSITA; Predehl et al. 2021) onboard the Spektrum-Roentgen-Gamma mission (SRG; Sunyaev et al. 2021), we are now able to conduct new studies of the X-ray activity of period-bouncers. Even though the high sensitivity of instruments like XMM-Newton is required to identify accreting period-bounce systems, the enormous statistical samples of faint X-ray sources being observed by eROSITA are expected to boost the number of new detections and new identifications among period-bounce candidates. In this article, we carry out an analysis of the first detections of X-ray emission from period-bouncers based on the eROSITA All-Sky surveys, the last of which so far was completed in winter 2021.
The pilot sample of period-bounce candidates is introduced in more detail in Sect. 2. For SDSS 1514, we present a dedicated XMM-Newton observation in Sect. 3. In Sect. 4, we discuss the detections of period-bounce candidates from this sample in the source catalogs of eROSITA. Finally, we give our conclusions in Sect. 5.
2. Sample of period-bounce candidates
The pilot sample of short-period systems that we selected for our search of X-ray emission is drawn from Breedt et al. (2012). These systems (i.e., V379 Vir, SDSS 1250, and SDSS 1514) are composed of a magnetic WD and a presumably very low-mass donor. The WD has been previously identified as being magnetic based on SDSS spectra, specifically from the Zeeman splitting of the Balmer absorption lines (Schmidt et al. 2005; Vanlandingham et al. 2005; Külebi et al. 2009). This sample of candidates also shares some other characteristics, including large radial velocity variations, variable Hα emission, a ∼10 000 K WD, and light curves taken with the Catalina Real-time Transient Survey that show no large-scale variability, eclipses, or high states.
The system V379 Vir is the only candidate with a near-IR spectrum where the donor’s photospheric features of spectral type L8 were identified together with the contribution of cyclotron emission from the magnetic accreting WD (Farihi et al. 2008). In the absence of spectroscopic evidence, IR photometry can be used to estimate the donor spectral type of all three candidates: L5 or later for V379 Vir, estimated by Schmidt et al. (2005) by comparing the absolute J-band magnitude of the system to observed absolute J-band magnitudes of L and T dwarfs; L3 or later for SDSS 1514, estimated by Breedt et al. (2012) from the near-IR excess in the spectral energy distribution (SED); and M8 for SDSS 1250, estimated by Steele et al. (2011) by comparing the absolute JH band magnitude of the system to the observed absolute JH band magnitudes of M, L, and T dwarfs. At this spectral type, the secondary of SDSS 1250 would be slightly above the substellar limit on the donor sequence of Knigge (2006). However, the photometry used to estimate the donor spectral type was considered uncertain by Steele et al. (2011), making a spectroscopic confirmation mandatory for this system.
Some relevant system properties are summarized in Table 1. We identify the candidates by their shortened SDSS name or variable star designation in the first column of the table. The second column of the table reports the distance obtained from the Gaia-DR3 parallax. The third column shows the orbital period derived by different authors using the Hα emission line. The fourth column presents the estimated spectral type of the donor, as described above, and the fifth column shows the estimated WD magnetic field strength.
Relevant properties of our pilot sample of period-bounce candidates.
To estimate the individual WD radii and masses, we fitted WD atmosphere models by Koester (2010) to the SDSS spectra1 of the period-bounce candidates in our pilot sample while considering values for Teff and log(g) previously reported in the literature. Because these systems are magnetic WDs, the Balmer lines cannot be used, and our fits rely solely on the continuum. Since we selected the appropriate model (Teff, log(g)) beforehand, the fit has a single parameter: the ratio between the observed flux from the SDSS spectrum and the model surface flux. This ratio represents the dilution factor, (d/R*)2, where d is the distance and R* is the stellar radius. From the Gaia-DR3 distance we could therefore derive the WD radius. From the radius and an appropriate mass–radius relation, we obtained the WD mass.
For SDSS 1514 and SDSS 1250, we used the 10 000 K DA WD spectrum with log(g) = 8.0 corresponding to the parameters derived by Breedt et al. (2012) for the two stars from the same SDSS spectra. With the Gaia-DR3 distances in Table 1, we obtained a WD radius of 7.0 × 108 cm for SDSS 1514 and of 7.2 × 108 cm for SDSS 1250. From these values, we derive the WD masses using the mass-radius relation by Nauenberg (1972) of 0.80 M⊙ and 0.77 M⊙, respectively.
For V379 Vir, we used a 11 000 K DA WD spectrum with log(g) = 8.0 following the WD temperature obtained by Burleigh et al. (2006) for the same SDSS spectra and assumed a log(g) similar to the other candidates in our pilot sample. With the Gaia-DR3 distance in Table 1, we obtained a WD radius of 8.3 × 108 cm, and from this value, we derived a WD mass using the mass-radius relation by Nauenberg (1972) of 0.64 M⊙.
We report that Gentile Fusillo et al. (2021) derived a WD mass for all three systems in our sample using Gaia photometry and astrometry to fit stellar parameters. From this fitting process, they obtained effective temperatures of 10 668 ± 444 K, 8057 ± 1234 K, and 8211 ± 311 K and a log(g) of 8.0 ± 0.1, 7.6 ± 0.5, and 7.8 ± 0.1 for V379 Vir, SDSS 1514, and SDSS 1250, respectively. Using a pure-H atmosphere model Gentile Fusillo et al. (2021) obtained a WD mass of 0.62 ± 0.07 M⊙, 0.41 ± 0.20 M⊙, and 0.48 ± 0.05 M⊙ for V379 Vir, SDSS 1514, and SDSS 1250 respectively. The values for V379 Vir are consistent with the ones applied to the SDSS spectra. For the other two candidates, the values are considerably lower than the ones we obtained from the SDSS spectra.
3. XMM-Newton observation of SDSS J1514
The observation of SDSS 1514 by XMM-Newton occurred on January 14, 2020. It had a duration of 41 ks (Obs-ID 0840380201; PI Stelzer) and was performed with all EPIC instruments (Strüder et al. 2001; Turner et al. 2001) using the THIN filter, and with the Optical Monitor (OM; Mason et al. 2001) in FAST MODE using the V-band filter.
3.1. X-ray data
The system SDSS 1514 was detected in all EPIC instruments, giving a net count rate of 0.0042 ± 0.0004 cts s−1 in the MOS1 and of 0.0121 ± 0.0011 cts s−1 in the MOS2 cameras. Considering how faint the source is in the MOS instrument, we limited the analysis to EPIC/pn, which provides the highest sensitivity of the EPIC detectors, as can be seen in the net source count rates presented in Table 2. The data analysis was carried out with XMM-Newton’s Standard Science Analysis System (SAS) version 19.1.0. The observation is slightly affected by a flaring particle background; therefore, we retained only the events for which the count rate measured over the full detector area fulfills RATE ≤ 0.6 cts s−1, leaving an exposure time of 37 ks for the analysis. We filtered the data for pixel patterns (PATTERN ≤ 4), quality flag (FLAG = 0), and events channels (200 ≤ PI ≤ 12 000). Source detection was performed in three energy bands, namely, 0.2–1.0 keV (S), 1.0–2.0 keV (M), and 2.0–12.0 keV (H), using a customized procedure based on the steps implemented in the SAS task EDETECT_CHAIN.
X-ray count rate and PF from a sine fit for SDSS 1514 EPIC/pn data in different energy bands.
For the spectral and temporal analysis we defined a circular photon extraction region with radius of 30″ centered on the EPIC/pn source position. To ensure a homogeneous signal, the background was taken as the average of three adjacent circular regions on the same CCD chip, each with a radius of 30″. The background subtraction of the light curve was carried out with SAS task EPICLCCORR, which also corrects for instrumental effects, on an event list that was previously barycenter corrected using the SAS tool BARYCEN.
The X-ray light curve shows a clear periodic modulation in all energy bands and a larger amplitude for softer emission, as can be observed in Fig. 1. The modulation displays an on-off behavior that is typical for Polars (Cropper 1990). In the minimum, the count rate drops to approximately zero, suggesting that the area of accretion, presumably the magnetic pole cap of the WD, is completely occulted. A Lomb-Scargle periodogram analysis of the broad-band light curve yielded a period of Porb = 87.93 ± 0.30 min. This value and its 1σ error were derived with a bootstrap approach from 5000 simulated broad-band light curves that were generated by drawing the count rates of individual bins randomly from the range defined by the count rate errors. This period is in good agreement with the published period derived from the Hα emission (88.7 min; Breedt et al. 2012).
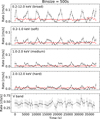 |
Fig. 1. EPIC/pn X-ray light curve of SDSS 1514 in four energy bands plus the OM V-band light curve. The energy band is indicated in the upper-left corner of each panel. The bin size is 500 s in all panels. The X-ray light curves represent the background-subtracted source signal (black), and background signal (red) is included for comparison. |
To first approximation, we fitted a sinusoid to the X-ray light curve of each energy band. We determined the pulsed fraction (PF) taking into account the uncertainties on the y-offset and amplitude of the sine curve. The values obtained for the individual energy bands (see Table 2) are consistent with the 100% PF typically observed in Polars (Norton & Watson 1989). The phase-folded light curve shown in Fig. 2 was obtained using the High Energy Astrophysics Science Archive Research Center (HEASARC) tool EFOLD, which uses an input of 11 phase bins to calculate a new bin time of 479.61 s corresponding to the duration of a phase bin in the folded light curve. The folded light curve more clearly displays the already mentioned on-off behavior with a faint phase that is slightly longer than the bright phase.
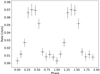 |
Fig. 2. X-ray light curve (EPIC/pn 0.2–12 keV) of SDSS 1514 folded using the period determined from the X-ray signal. The bin size is 479.61 s. |
We used Fig. 2 to constrain the geometry of the system. Radial accretion at the magnetic pole can be described by the duration of the faint phase (γ) in fractions of the orbital period, where the WD is viewed at an angle i to the rotation axis (the inclination) such that the magnetic pole is located at a colatitude β (angle between the rotation and the magnetic axis) given by Cropper (1990) as
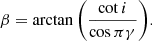 (1)
(1)
We did not see evidence of eclipses in the V-band lightcurve (Fig. 1), meaning that we could therefore set a rough upper limit to the inclination of i < 75°. Considering that we observed occultation in the X-ray light curve, a lower limit was assumed at i > 10° so that the hot spot moved in and out of view due to the rotation of the WD. Together with the observed duration of the faint phase (γ = 0.46) determined from the folded light curve in Fig. 2, we found a range of 65° < β < 89° for the colatitude of the magnetic pole using Eq. (1). This result gave us information about the geometry of the system. For β < 90°, the accreting pole is on the same side of the orbital plane as our line of sight. The high value for β suggests a large misalignment between the rotation axis of the WD and its magnetic field. In Fig. 2, the shape of the folded X-ray light curve indicates that the rise and decline to the maximum are approximately of the same duration. This suggests that the emission region is symmetrical; however, with the available data we could not discern if the extent is vertical or lateral.
To constrain the properties of the X-ray emitting plasma, we fitted the EPIC/pn spectrum of SDSS 1514 using the X-Ray Spectral Fitting Package (XSPEC; Arnaud 1996). We performed two separate fits considering, in both cases, a simple absorber (TBABS), the first with a single-component thermal model (APEC) and the second with a thermal Bremsstrahlung model (BREMS). The APEC fit was carried out using the abundances from Asplund et al. (2009).
The BREMS and the APEC models provided consistent values for the X-ray temperature of the system (see Table 3). For the APEC model, we obtained a subsolar abundance that is however ill-constrained, and its uncertainty also allowed for zero metallicity. This might be explained by the lack of strong emission lines at the plasma temperature of about 4 keV as well as the low S/N ratio of the spectrum, thus justifying the use of a pure Bremsstrahlung model. The neutral hydrogen column density also appeared to be unconstrained and compatible with no absorption of the source. The range obtained from our spectral fits for the gas column density fell within the upper limit for the galactic absorption2 in the direction of SDSS 1514, which is estimated at 2.2 × 1020 cm−2 (Bekhti et al. 2016). The BREMS and the APEC models yielded a similar  , and we could not distinguish between these two models at the statistics of our observation. We show in Fig. 3 the observed EPIC/pn spectrum together with the APEC model and residuals.
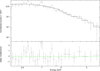 |
Fig. 3. Time-averaged EPIC/pn X-ray spectrum of SDSS 1514 with the APEC model and residuals. |
Best-fit parameters for the XMM-Newton EPIC/pn spectrum of SDSS 1514 and values corresponding to upper and lower 90% confidence ranges.
We also performed several APEC fits with abundances fixed at different values and found that this has a negligible influence on the X-ray flux. Therefore, based on the average flux from all the different APEC fits we performed, we adopted an unabsorbed flux of fX = 7.3 × 10⁻¹⁴ erg cm2 s−1 in the 0.2 − 12 keV-band. For the 0.1 − 2.4 keV ROSAT band, the average X-ray flux is 4.5 × 10⁻¹⁴ erg cm2 s−1. This latter value is in accordance with the upper limit placed on the X-ray flux by the ROSAT non-detection at ≤6 × 10⁻¹⁴ erg cm2 s−1 for this energy band (Breedt et al. 2012). Using the best-fit APEC parameters and a dummy response that covers a broad energy range, we calculated the bolometric X-ray flux to obtain a bolometric correction factor of 1.10.
With its Gaia-DR3, distance we determine the bolometric X-ray luminosity to log(LX) [erg s−1] = 29.5, and from this value, we derived a mass accretion rate of Ṁacc = 3.3 × 10⁻¹⁴ M⊙ yr−1, obtained by adopting the WD mass and radius derived in Sect. 2 for the SDSS spectra of SDSS 1514. A mass accretion rate of Ṁacc = 9.4 × 10⁻¹⁴ M⊙ yr−1 was obtained by adopting the WD mass and radius SDSS 1514 from Gentile Fusillo et al. (2021). Similar to the conclusion reached by Stelzer et al. (2017), the estimated lower limit for the accretion rate in this system is orders of magnitude too high to be accounted for by a wind-driven mass accretion rate mechanism, making Roche-lobe overflow the most likely accretion mechanism for SDSS 1514.
Because we are working with magnetic targets, a contribution of cyclotron emission to the overall flux (and therefore luminosity) of the systems might be present. Cyclotron flux depends on several parameters, such as the electron temperature kTe and density Ne, the magnetic field strength, and the angle between the line of sight and the magnetic field vector (see Schwope et al. 1990). Hence, even a rough estimate of cyclotron flux needs assumptions regarding several unknown parameters. In addition, at low accretion rates, the plasma is likely in a non-hydrodynamic regime. Thus, such quantification is beyond the scope of the present work. We instead preferred to report accretion rates for the sources obtained from X-ray data that should henceforth be taken as lower limits.
The EPIC/pn X-ray count rate in the minimum of the light curve (0.64 ≤ ϕ ≤ 1.09) is 0.0083 cts s−1 with a standard deviation of 0.0091 cts s−1, that is, SDSS 1514 is undetected. We produced an EPIC/pn sensitivity map for the combined time intervals corresponding to the range of phases ϕ that define this minimum. We then multiplied the value of the count rate of this map at the source position with the rate-to-flux conversion factor derived from the time-averaged X-ray spectrum. This way, we obtained the upper limit to the X-ray emission at the orbital minimum of log LX, min [erg s−1]< 28.3. The coronal emission of the only two L dwarfs detected in X-rays so far is log LX, min [erg s−1]< 27.0 (Audard et al. 2007; De Luca et al. 2020). In other words, we did not obtain any constraints on the L dwarf’s X-ray emission from this observation.
3.2. Optical data
The V-band photometry acquired with the OM in FAST MODE was taken simultaneously with the X-ray observation and was extracted with the SAS task OMFCHAIN. In addition, the time series was barycenter corrected.
A Lomb-Scargle periodogram analysis of the V-band did not yield a significant periodicity, and when folded on the X-ray period, no phase-related variability was observed. The system SDSS 1514 is optically faint, and at the time of the observation, the system was at VOM = 18.92 ± 0.32 mag, which is about one magnitude above the sensitivity limit of the OM. The variability for the V-band was obtained by converting the OM count rates into fluxes using the conversion factor given in the XMM-Newton SAS user guide3. We used the values for the average flux (fluxavg) and for the maximum flux (fluxmax) in the light curve to estimate the magnitude change as Δmag = −2.5log10(fluxmax/fluxavg). This gave a variability amplitude of Δmag = 0.47 mag, or around 2.5%. This percentage is consistent with the variability estimate made by Burleigh et al. (2006) for the V-band light curve of V379 Vir of about 3%. However, as can be seen in Fig. 1, the variation in the OM light curve of SDSS 1514 is not significant, due to the low statistics of the OM data.
4. eROSITA detections
Four full-sky surveys have been carried out with eROSITA, namely, eRASS 1 to eRASS 4. Source catalogs from eRASS data are produced at the Max Planck Institut für extraterrestrische Physik (MPE) in Garching, Germany, with the eROSITA Science Analysis Software System (eSASS) described by Brunner et al. (2022). These catalogs are composed of all eRASS sources in the western half of the sky in terms of Galactic coordinates, that is, Galactic longitude l ≥ 180°, which is the sky area with German data rights.
To obtain the highest sensitivity for detecting the presumably faint period-bounce candidates, we used the merged catalog eRASS:3 that was generated from summing data from the first three all-sky surveys. The latest version of the eRASS:3 catalog, which was made available to us in December 2022, was produced with the data processing version 0204. Source detection was performed in this catalog for a single eROSITA energy band: 0.2 − 2.3 keV.
In order to search for the period-bouncers from our pilot sample in eRASS data, we performed an initial match between our targets and the Gaia-DR3 catalog. Using the corresponding Gaia-DR3 proper motions, we corrected the coordinates of the objects to the mean observing date of eRASS:3. Then we matched them with the eRASS:3 catalog, allowing for a maximum separation of 30″. After establishing the closest matches for our pilot sample, we carried out a visual inspection in a 30″ radius region around the X-ray source to assure that there where no other potential optical counterparts. In Table 4, we report the X-ray parameters obtained from the merged eRASS:3 catalog for the matches of the two period-bouncers with eROSITA detections, V379 Vir and SDSS 1250. The system SDSS 1514 is located in the sky area with exclusive Russian eROSITA data rights, and therefore, it is not included in the eRASS:3 catalog. As can be seen from Table 4, the sources are faint in the eRASS surveys, with only tens of counts in the merged data from the first three eROSITA surveys, yet they are significantly above the detection likelihood limit of five set for the eRASS:3 merged catalog.
X-ray parameters from the eROSITA merged catalog eRASS:3 for V379 Vir and SDSS 1250 given for the eROSITA single band (0.2–2.3 keV).
In the eROSITA eRASS:3 catalog, the single band flux was calculated for a power law model with an index Γ = 2.0 and a galactic absorption of NH = 3 × 1020 cm−2 (Brunner et al. 2022). Since this spectral model is not appropriate for CVs, we computed fluxes for an APEC model with the help of a simulation that provided us with the eROSITA conversion factor, CFeROSITA, APEC, from count rate to thermal flux.
Next, we generated a “fake” spectrum using the FAKEIT command available in XSPEC together with the eROSITA response files. We chose an APEC model with kT = 2.62 keV, NH = 2.3 × 1020 cm−2 and an abundance of 0.11 Z⊙, which are the values found from the XMM-Newton spectrum for one of our targets (see Stelzer et al. 2017). We then produced another simulated eROSITA spectrum for the power law model used in the eRASS catalogs. From both synthetic spectra, we then retrieved the flux and the count rate in the single band, using these values to calculate a CFfake, APEC and a CFfake, powerlaw. The results are shown in Table 5, where it can be seen that these two CFs differ by only 3.36%. This result allowed us to derive the CFeROSITA, APEC from the CFeROSITA, powerlaw used in the eRASS catalogs. The final values for the APEC fluxes for the eROSITA single band (0.2–2.3 keV), given in Table 4, were calculated using the catalog count rate and the APEC eROSITA conversion factor as FluxAPEC = Count Rate/CFeROSITA, APEC. Analogous to the analysis of the XMM-Newton data, the APEC parameters and a dummy response that covers a broad energy range were used to calculate the bolometric X-ray flux. We obtained a bolometric correction factor of 1.60. With the Gaia-DR3 distances, we obtained the bolometric X-ray luminosity and mass accretion rate of each of our targets (see Table 4) by using the WD mass and radius obtained for each object in Sect. 2. By using the values for the WD masses obtained by Gentile Fusillo et al. (2021) from Gaia photometry combined with a WD radius from the Nauenberg (1972) mass–radius relation, we obtained a mass accretion rate of Ṁacc = 5.5 × 10⁻¹⁴ M⊙ yr−1 for V379 Vir and of Ṁacc = 3.7 × 10⁻¹⁴ M⊙ yr−1 for SDSS 1250. In the latter case, the mass accretion rate is more than two time greater than the value we calculated based on the WD mass from the SDSS spectra.
Rate-to-flux conversion factors in the eROSITA single band (0.2–2.3 keV).
5. Discussion and conclusions
We detected X-ray emission from all three magnetic period-bouncer candidates. These systems are emitting at a similar level of Lx ≈ 1029 [erg s−1] and hence displaying similar mass accretion rates under the assumption that the WD mass is similar in all systems.
In Stelzer et al. (2017), an APEC flux value was reported for V379 Vir in the XMM-Newton broadband (0.2–12.0 keV) of 1.3 × 10⁻¹³ erg cm−2 s−1. Since the X-ray spectra of V379 Vir and SDSS 1514 are very similar we can use the XMM-Newton spectrum of SDSS 1514 analyzed in this paper to estimate the flux of V379 Vir in the eROSITA band at its XMM-Newton epoch. In XSPEC, we calculated a flux ratio of 1.76 for SDSS 1514 between the XMM-Newton broadband and the 0.2–2.3 keV-band used in the eRASS:3 catalog. From this, we inferred the flux of V379 Vir in the eRASS:3 energy band at the XMM-Newton epoch to be 7.1 × 10⁻¹⁴ erg cm−2 s−1. A comparison with the observed eROSITA flux presented in Table 4 for V379 Vir showed that there is only a 5.7% difference between the two values, and considering the error bars, the two brightness measurements are consistent with each other, that is, the system’s X-ray luminosity (averaged over the orbital cycle) did not change on timescales of a few years.
For two of the three systems, V379 Vir and SDSS 1514, we found X-ray orbital modulation through the long, sensitive XMM-Newton observations presented by Stelzer et al. (2017) and this paper respectively. The fluxes discussed in the previous paragraph therefore represent time averages over several orbital cycles. In the case of eROSITA, the flux is the average over three surveys separated from each other by six months. Within each survey, V379 Vir and SDSS 1250 were observed between 6 and 11 times for around 20 s–40 s with a gap of approximately 4 h between the individual exposures, as defined by the scanning law of eROSITA (see e.g., Predehl et al. 2021). Given the faintness of the sources, we refrained from performing a search of variability in the eRASS data.
The X-ray detection of our targets confidently proves that accretion is taking place. We have thus demonstrated that X-ray emission is an efficient way of identifying CVs with very low-mass donors. While the periodic X-ray variability testifying to the accretion geometry requires a high sensitivity that can only be achieved with dedicated X-ray pointings, we have shown that the flux limit of the merged data from the eROSITA surveys is sufficient to provide a weak detection for systems at distances out to ∼200 pc. A rough projection of the prospects for a systematic search for period-bouncers in the eRASS:3 catalog can be done using the X-ray flux limit of the survey and an estimate of the space density of CVs in an exponential disk.
To this end, we used the fainter eRASS detection among our pilot sample, SDSS 1250, as a reference point to estimate the distance limit for period-bouncers of eRASS:3. Using a detection likelihood of DET_ML > 20, which corresponded to the value for SDSS 1250 (see Table 4), 95% of the sources in the eRASS:3 catalog have a flux higher than 2 × 10⁻¹⁴ erg cm−2 s−1. Combined with the “typical” X-ray luminosity of our pilot targets (1029 erg s−1) this yielded an approximate distance limit of ∼200 pc for eROSITA discoveries of accreting WDs with very low-mass donors in the merged eRASS 1 to eRASS 3 database. We caution that this estimate may apply only to magnetic systems that tend to be X-ray brighter than non-magnetic CVs (Cropper 1990). On the other hand, our detection likelihood threshold is very conservative. Values of DET_ML = 11 have been shown to define samples with only modest contamination by spurious sources (Wolf et al. 2021).
A possible starting point in the search of new period-bounce candidates is the Gaia catalog of WDs by Gentile Fusillo et al. (2021), which presents a list of approximately 360 000 genuine WDs and was constructed through a comprehensive selection based on Gaia magnitudes and colors with consideration for diverse quality flags. In Fig. 4, we display as a green sample the “high-fidelity” WDs with distances within the eRASS:3 limit estimated above.
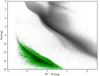 |
Fig. 4. Gaia color–magnitude diagram showing the position of the “high-fidelity” WDs from Gentile Fusillo et al. (2021) with a distance limit of 200 pc (green). The three period-bouncers from our pilot sample that are also in the Gentile Fusillo et al. (2021) catalog are shown in red. The Gaia-DR3 sources with Bailer-Jones et al. (2021) distances are shown in gray as a reference. |
The “high-fidelity” WDs are objects with a probability of being a WD, PWD ≥ 0.75, as derived by Gentile Fusillo et al. (2019) from the position of the objects in the Gaia color–magnitude diagram compared to the WD density map obtained from confirmed SDSS WDs. The sample shown in Fig. 4 in green comprises 91 089 objects. Overlaid are the three period-bouncers from our pilot X-ray survey (marked in red), all of which are present in the Gentile Fusillo et al. (2021) catalog. All three are located in the same area as the Gaia WD subsample, indicating that the Gaia WD catalog by Gentile Fusillo et al. (2021) might include further period-bouncers.
In Fig. 4, we present in gray a large sample of Gaia-DR3 sources to serve as reference. This sample was selected considering only the sources with a distance obtained by Bailer-Jones et al. (2021) and a parallax error less than 1% of the parallax value.
The expected estimated number of period-bouncers within the eRASS:3 distance limit is determined by the space density of CVs, which is highly uncertain and ranges from 2 × 10⁻⁴ pc−3 (de Kool 1992) to 4.8 × 10⁻⁶ pc−3 (Pala et al. 2020). Considering this, for the space density of period-bouncers in the Galactic midplane, we assumed ρ0 ∼ 10−5 pc−3, which is twice the value estimated for “normal” CVs from their observed X-ray luminosity function (Pretorius & Knigge 2012). An exponential vertical density profile with a scale height of 260 pc for short-period systems (Pretorius & Knigge 2012) then yields approximately 340 period-bouncers within 200 pc. Since the eRASS:3 catalog comprises only half of the sky, the actual expected number of period-bouncers hidden in this catalog is around 170. When considering a 450 pc scale height proposed by Pretorius & Knigge (2012) specifically for period-bouncers, we obtained approximately 400 period-bouncers within 200 pc with around 200 period-bouncers that should be found in the eRASS:3 catalog. The number would be lower if the majority of period-bouncers had a lower X-ray luminosity than the benchmark systems we studied in this work. However, the theoretically predicted mass accretion rates (on the order of Ṁacc ∼ 10−11 M⊙ yr−1; Goliasch & Nelson 2015) are much higher than expected from the observed LX values, and this suggests that the number of X-ray detections might be substantially higher than the estimate above.
Considering the all-sky nature of eROSITA’s surveys, this instrument is ideal for population studies. As we have shown here, with the detections of V379 Vir and SDSS 1250, the eRASS data is suitable for searching for new period-bounce candidates. Once accretion has been proven in a system through an X-ray detection, an infrared spectrum should be obtained to confirm the late spectral type of the donor and thus confidently verify the system as a period-bouncer. The discovery of more period-bouncers and the observational characterization of this object class is expected to provide new impetus for theoretical studies of binary evolution.
The source catalog used in our work is all_s3_SourceCat1B_221007_poscorr_mpe_clean.fits (for eRASS:3).
Acknowledgments
We thank an anonymous referee for reviewing the original manuscript and giving helpful comments and useful advice. Daniela Muñoz-Giraldo acknowledges financial support from Deutsche Forschungsgemeinschaft (DFG) under grant number STE 1068/6-1. Domitilla de Martino acknowledges financial support from ASI and INAF. This work is based on observations obtained with XMM-Newton, an ESA science mission with instruments and contributions directly funded by ESA Member States and NASA. This work is based on data from eROSITA, the primary instrument aboard SRG, a joint Russian-German science mission supported by the Russian Space Agency (Roskosmos), in the interests of the Russian Academy of Sciences represented by its Space Research Institute (IKI), and the Deutsches Zentrum für Luft- und Raumfahrt (DLR). The SRG spacecraft was built by Lavochkin Association (NPOL) and its subcontractors, and is operated by NPOL with support from the Max Planck Institute for Extraterrestrial Physics (MPE). The development and construction of the eROSITA X-ray instrument was led by MPE, with contributions from the Dr. Karl Remeis Observatory Bamberg and ECAP (FAU Erlangen-Nürnberg), the University of Hamburg Observatory, the Leibniz Institute for Astrophysics Potsdam (AIP), and the Institute for Astronomy and Astrophysics of the University of Tübingen, with the support of DLR and the Max Planck Society. The Argelander Institute for Astronomy of the University of Bonn and the Ludwig Maximilians Universität München also participated in the science preparation for ero. The eROSITA data shown here were processed using the eSASS/NRTA software system developed by the German eROSITA consortium. This work has made use of data from the European Space Agency (ESA) mission Gaia (https://www.cosmos.esa.int/gaia), processed by the Gaia Data Processing and Analysis Consortium (DPAC, https://www.cosmos.esa.int/web/gaia/dpac/consortium). Funding for the DPAC has been provided by national institutions, in particular the institutions participating in the Gaia Multilateral Agreement.
References
- Amantayeva, A., Zharikov, S., Page, K., et al. 2021, ApJ, 918, 58 [NASA ADS] [CrossRef] [Google Scholar]
- Arnaud, K. 1996, in Astronomical Data Analysis Software and Systems V, ASP Conf. Ser., 101, 17 [NASA ADS] [Google Scholar]
- Asplund, M., Grevesse, N., Sauval, A. J., & Scott, P. 2009, ARA&A, 47, 481 [NASA ADS] [CrossRef] [Google Scholar]
- Audard, M., Osten, R., Brown, A., et al. 2007, A&A, 471, L63 [NASA ADS] [CrossRef] [EDP Sciences] [Google Scholar]
- Bailer-Jones, C. A. L., Rybizki, J., Fouesneau, M., Demleitner, M., & Andrae, R. 2021, AJ, 161, 147 [Google Scholar]
- Bekhti, N. B., Flöer, L., Keller, R., et al. 2016, A&A, 594, A116 [NASA ADS] [CrossRef] [EDP Sciences] [Google Scholar]
- Belloni, D., Schreiber, M. R., Pala, A. F., et al. 2020, MNRAS, 491, 5717 [Google Scholar]
- Breedt, E., Gaensicke, B. T., Girven, J., et al. 2012, MNRAS, 423, 1437 [NASA ADS] [CrossRef] [Google Scholar]
- Brunner, H., Liu, T., Lamer, G., et al. 2022, A&A, 661, A1 [NASA ADS] [CrossRef] [EDP Sciences] [Google Scholar]
- Burleigh, M. R., Marsh, T., Gänsicke, B., et al. 2006, MNRAS, 373, 1416 [NASA ADS] [CrossRef] [Google Scholar]
- Cropper, M. 1990, Space Sci. Rev., 54, 195 [CrossRef] [Google Scholar]
- de Kool, M. 1992, A&A, 261, 188 [NASA ADS] [Google Scholar]
- De Luca, A., Stelzer, B., Burgasser, A. J., et al. 2020, A&A, 634, L13 [NASA ADS] [CrossRef] [EDP Sciences] [Google Scholar]
- Farihi, J., Burleigh, M., & Hoard, D. 2008, ApJ, 674, 421 [NASA ADS] [CrossRef] [Google Scholar]
- Gänsicke, B., Dillon, M., Southworth, J., et al. 2009, MNRAS, 397, 2170 [CrossRef] [Google Scholar]
- Gentile Fusillo, N. P., Tremblay, P.-E., Gänsicke, B. T., et al. 2019, MNRAS, 482, 4570 [Google Scholar]
- Gentile Fusillo, N., Tremblay, P., Cukanovaite, E., et al. 2021, MNRAS, 508, 3877 [NASA ADS] [CrossRef] [Google Scholar]
- Goliasch, J., & Nelson, L. 2015, ApJ, 809, 80 [Google Scholar]
- Hessman, F., Gänsicke, B., & Mattei, J. 2000, A&A, 361, 952 [NASA ADS] [Google Scholar]
- Howell, S. B., Nelson, L. A., & Rappaport, S. 2001, ApJ, 550, 897 [Google Scholar]
- Kawka, A., Vennes, S., Ferrario, L., et al. 2021, MNRAS, 507, L30 [NASA ADS] [CrossRef] [Google Scholar]
- King, A. 1988, Quart. J. Royal Astron. Soc., 29, 1 [Google Scholar]
- Knigge, C. 2006, MNRAS, 373, 484 [NASA ADS] [CrossRef] [Google Scholar]
- Knigge, C., Baraffe, I., & Patterson, J. 2011, ApJS, 194, 28 [Google Scholar]
- Koester, D. 2010, Mem. Soc. Astron. Ital., 81, 921 [Google Scholar]
- Külebi, B., Jordan, S., Euchner, F., Gänsicke, B., & Hirsch, H. 2009, A&A, 506, 1341 [NASA ADS] [CrossRef] [EDP Sciences] [Google Scholar]
- Littlefair, S., Dhillon, V., Marsh, T., et al. 2008, MNRAS, 388, 1582 [NASA ADS] [CrossRef] [Google Scholar]
- Mason, K., Breeveld, A., Much, R., et al. 2001, A&A, 365, L36 [NASA ADS] [CrossRef] [EDP Sciences] [Google Scholar]
- McAllister, M., Littlefair, S., Dhillon, V., et al. 2017, MNRAS, 467, 1024 [NASA ADS] [CrossRef] [Google Scholar]
- McAllister, M., Littlefair, S., Parsons, S., et al. 2019, MNRAS, 486, 5535 [NASA ADS] [CrossRef] [Google Scholar]
- Nauenberg, M. 1972, ApJ, 175, 417 [NASA ADS] [CrossRef] [Google Scholar]
- Neustroev, V., & Mäntynen, I. 2023, MNRAS, 523, 6114 [NASA ADS] [CrossRef] [Google Scholar]
- Neustroev, V., Marsh, T. R., Zharikov, S., et al. 2017, MNRAS, 467, 597 [NASA ADS] [Google Scholar]
- Norton, A., & Watson, M. 1989, MNRAS, 237, 853 [NASA ADS] [CrossRef] [Google Scholar]
- Pala, A. F., Schmidtobreick, L., Tappert, C., Gänsicke, B. T., & Mehner, A. 2018, MNRAS, 481, 2523 [NASA ADS] [CrossRef] [Google Scholar]
- Pala, A., Gänsicke, B., Breedt, E., et al. 2020, MNRAS, 494, 3799 [NASA ADS] [CrossRef] [Google Scholar]
- Pala, A., Gänsicke, B., Belloni, D., et al. 2022, MNRAS, 510, 6110 [NASA ADS] [CrossRef] [Google Scholar]
- Patterson, J. 1998, PASP, 110, 1132 [CrossRef] [Google Scholar]
- Patterson, J. 2011, MNRAS, 411, 2695 [NASA ADS] [CrossRef] [Google Scholar]
- Patterson, J., Thorstensen, J. R., & Kemp, J. 2005, PASP, 117, 427 [NASA ADS] [CrossRef] [Google Scholar]
- Predehl, P., Andritschke, R., Arefiev, V., et al. 2021, A&A, 647, A1 [EDP Sciences] [Google Scholar]
- Pretorius, M. L., & Knigge, C. 2012, MNRAS, 419, 1442 [NASA ADS] [CrossRef] [Google Scholar]
- Pretorius, M. L., Knigge, C., & Schwope, A. D. 2013, MNRAS, 432, 570 [Google Scholar]
- Schmidt, G. D., Szkody, P., Silvestri, N. M., et al. 2005, ApJ, 630, L173 [NASA ADS] [CrossRef] [Google Scholar]
- Schreiber, M. R., Zorotovic, M., & Wijnen, T. P. 2015, MNRAS, 455, L16 [Google Scholar]
- Schwope, A., & Christensen, L. 2010, A&A, 514, A89 [NASA ADS] [CrossRef] [EDP Sciences] [Google Scholar]
- Schwope, A., Beuermann, K., & Thomas, H.-C. 1990, A&A, 230, 120 [NASA ADS] [Google Scholar]
- Schwope, A., Worpel, H., & Traulsen, I. 2021, A&A, 646, A181 [NASA ADS] [CrossRef] [EDP Sciences] [Google Scholar]
- Steele, P., Burleigh, M., Dobbie, P., et al. 2011, MNRAS, 416, 2768 [NASA ADS] [CrossRef] [Google Scholar]
- Stelzer, B., de Martino, D., Casewell, S., Wynn, G., & Roy, M. 2017, A&A, 598, L6 [NASA ADS] [CrossRef] [EDP Sciences] [Google Scholar]
- Strüder, L., Briel, U., Dennerl, K., et al. 2001, A&A, 365, L18 [Google Scholar]
- Sunyaev, R., Arefiev, V., Babyshkin, V., et al. 2021, A&A, 656, A132 [NASA ADS] [CrossRef] [EDP Sciences] [Google Scholar]
- Turner, M. J., Abbey, A., Arnaud, M., et al. 2001, A&A, 365, L27 [CrossRef] [EDP Sciences] [Google Scholar]
- Vanlandingham, K. M., Schmidt, G. D., Eisenstein, D. J., et al. 2005, AJ, 130, 734 [NASA ADS] [CrossRef] [Google Scholar]
- Warner, B. 1995, Cataclysmic Variable Stars, (Cambridge: Cambridge University Press), 28 [CrossRef] [Google Scholar]
- White, N. 1981, ApJ, 244, L85 [NASA ADS] [CrossRef] [Google Scholar]
- Wolf, J., Nandra, K., Salvato, M., et al. 2021, A&A, 647, A5 [NASA ADS] [CrossRef] [EDP Sciences] [Google Scholar]
All Tables
X-ray count rate and PF from a sine fit for SDSS 1514 EPIC/pn data in different energy bands.
Best-fit parameters for the XMM-Newton EPIC/pn spectrum of SDSS 1514 and values corresponding to upper and lower 90% confidence ranges.
X-ray parameters from the eROSITA merged catalog eRASS:3 for V379 Vir and SDSS 1250 given for the eROSITA single band (0.2–2.3 keV).
All Figures
|
Fig. 1. EPIC/pn X-ray light curve of SDSS 1514 in four energy bands plus the OM V-band light curve. The energy band is indicated in the upper-left corner of each panel. The bin size is 500 s in all panels. The X-ray light curves represent the background-subtracted source signal (black), and background signal (red) is included for comparison. |
| In the text | |
|
Fig. 2. X-ray light curve (EPIC/pn 0.2–12 keV) of SDSS 1514 folded using the period determined from the X-ray signal. The bin size is 479.61 s. |
| In the text | |
|
Fig. 3. Time-averaged EPIC/pn X-ray spectrum of SDSS 1514 with the APEC model and residuals. |
| In the text | |
|
Fig. 4. Gaia color–magnitude diagram showing the position of the “high-fidelity” WDs from Gentile Fusillo et al. (2021) with a distance limit of 200 pc (green). The three period-bouncers from our pilot sample that are also in the Gentile Fusillo et al. (2021) catalog are shown in red. The Gaia-DR3 sources with Bailer-Jones et al. (2021) distances are shown in gray as a reference. |
| In the text | |
Current usage metrics show cumulative count of Article Views (full-text article views including HTML views, PDF and ePub downloads, according to the available data) and Abstracts Views on Vision4Press platform.
Data correspond to usage on the plateform after 2015. The current usage metrics is available 48-96 hours after online publication and is updated daily on week days.
Initial download of the metrics may take a while.