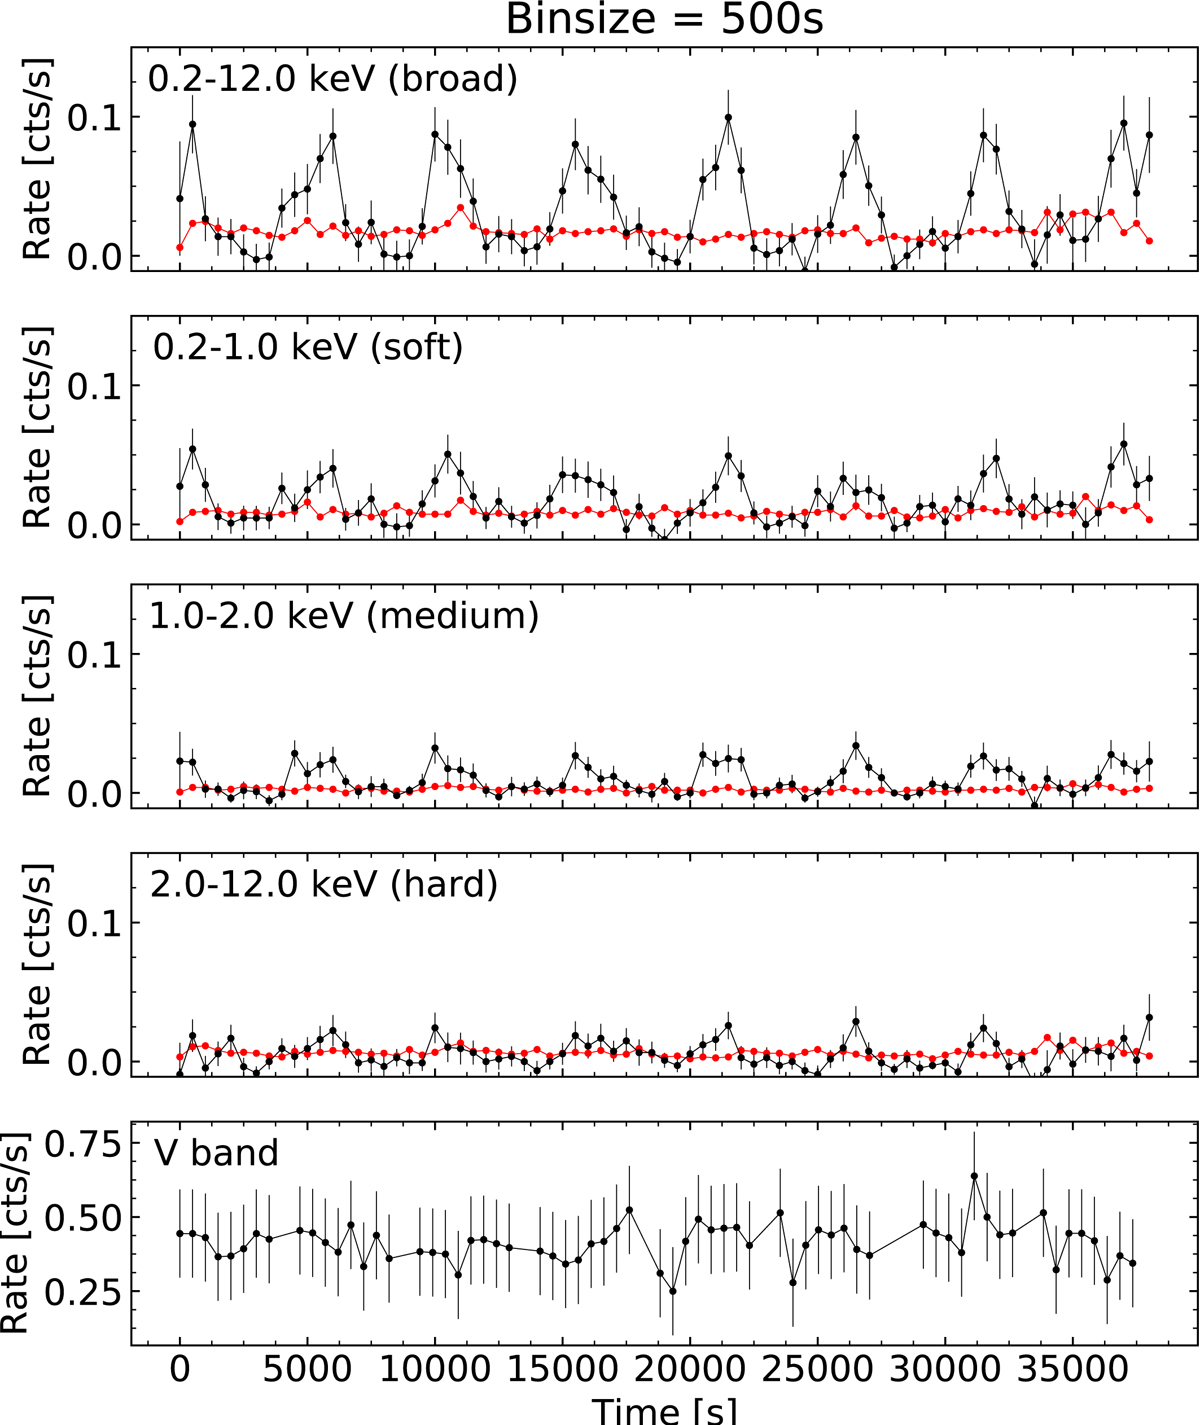
Fig. 1.
Download original image
EPIC/pn X-ray light curve of SDSS 1514 in four energy bands plus the OM V-band light curve. The energy band is indicated in the upper-left corner of each panel. The bin size is 500 s in all panels. The X-ray light curves represent the background-subtracted source signal (black), and background signal (red) is included for comparison.
Current usage metrics show cumulative count of Article Views (full-text article views including HTML views, PDF and ePub downloads, according to the available data) and Abstracts Views on Vision4Press platform.
Data correspond to usage on the plateform after 2015. The current usage metrics is available 48-96 hours after online publication and is updated daily on week days.
Initial download of the metrics may take a while.