Fig. A.1
Download original image
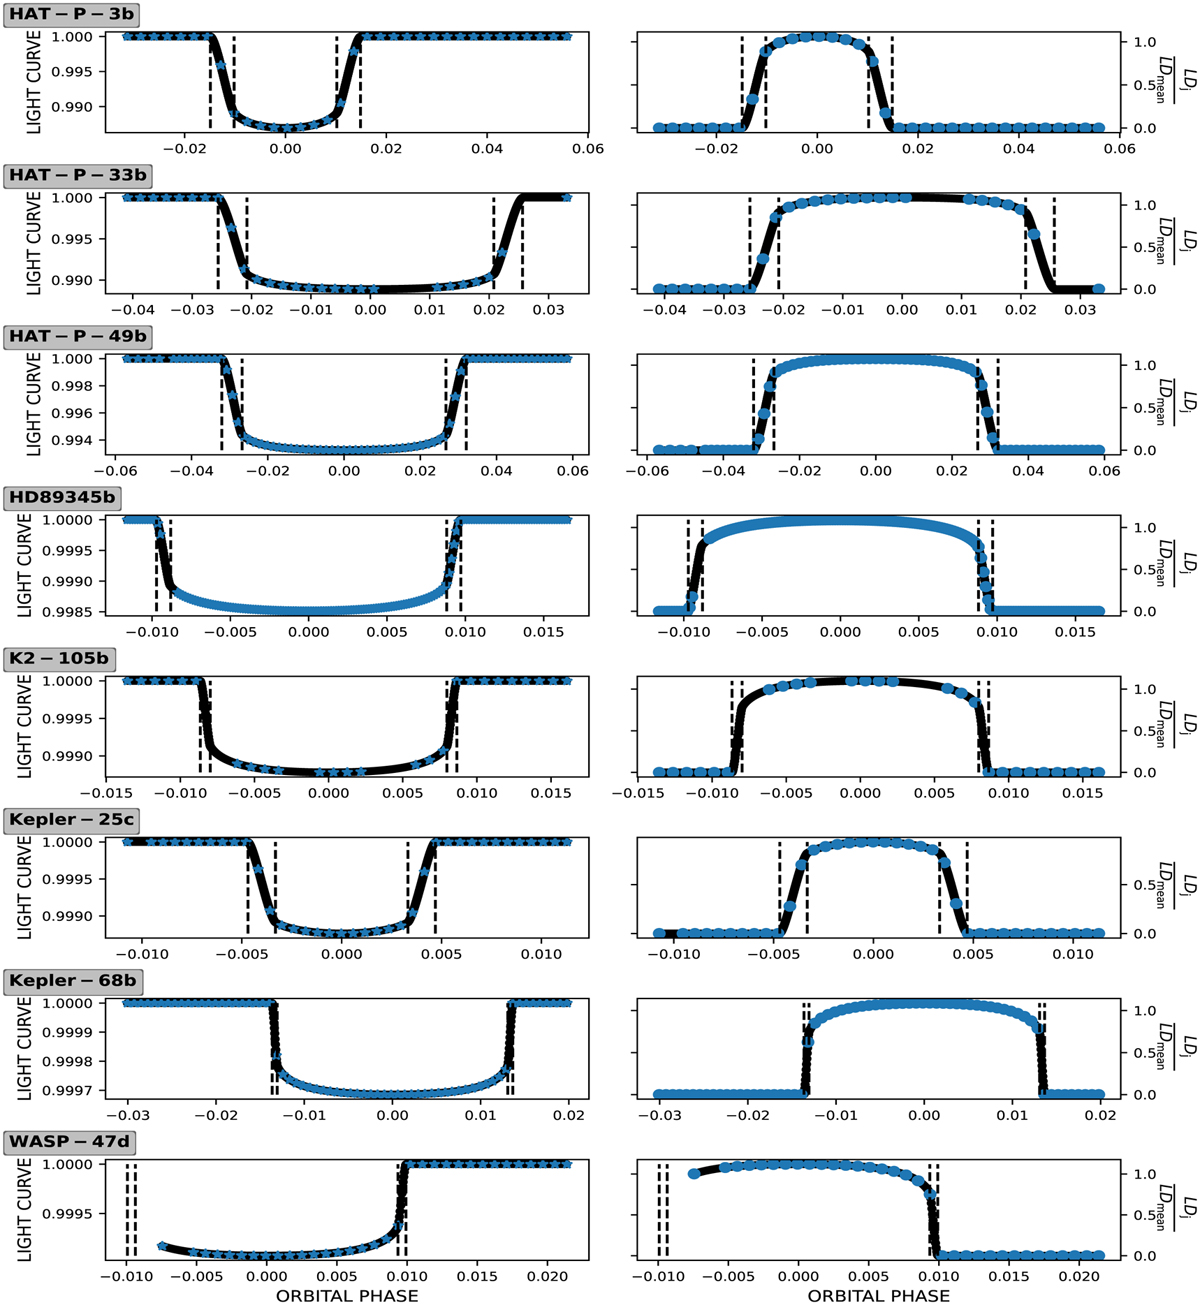
Light curves (left panels) and the limb-darkening ratio, namely, ![]() with j the orbital phase (right panels) computed with the Python batman code (Kreidberg 2015) and the system parameters from Table A.2. The contact points t1, t2, t3, and t4 are marked with vertical black lines. Blue dots are the light curves and limb-darkening ratio at the observed phases.
with j the orbital phase (right panels) computed with the Python batman code (Kreidberg 2015) and the system parameters from Table A.2. The contact points t1, t2, t3, and t4 are marked with vertical black lines. Blue dots are the light curves and limb-darkening ratio at the observed phases.
Current usage metrics show cumulative count of Article Views (full-text article views including HTML views, PDF and ePub downloads, according to the available data) and Abstracts Views on Vision4Press platform.
Data correspond to usage on the plateform after 2015. The current usage metrics is available 48-96 hours after online publication and is updated daily on week days.
Initial download of the metrics may take a while.