Fig. 8
Download original image
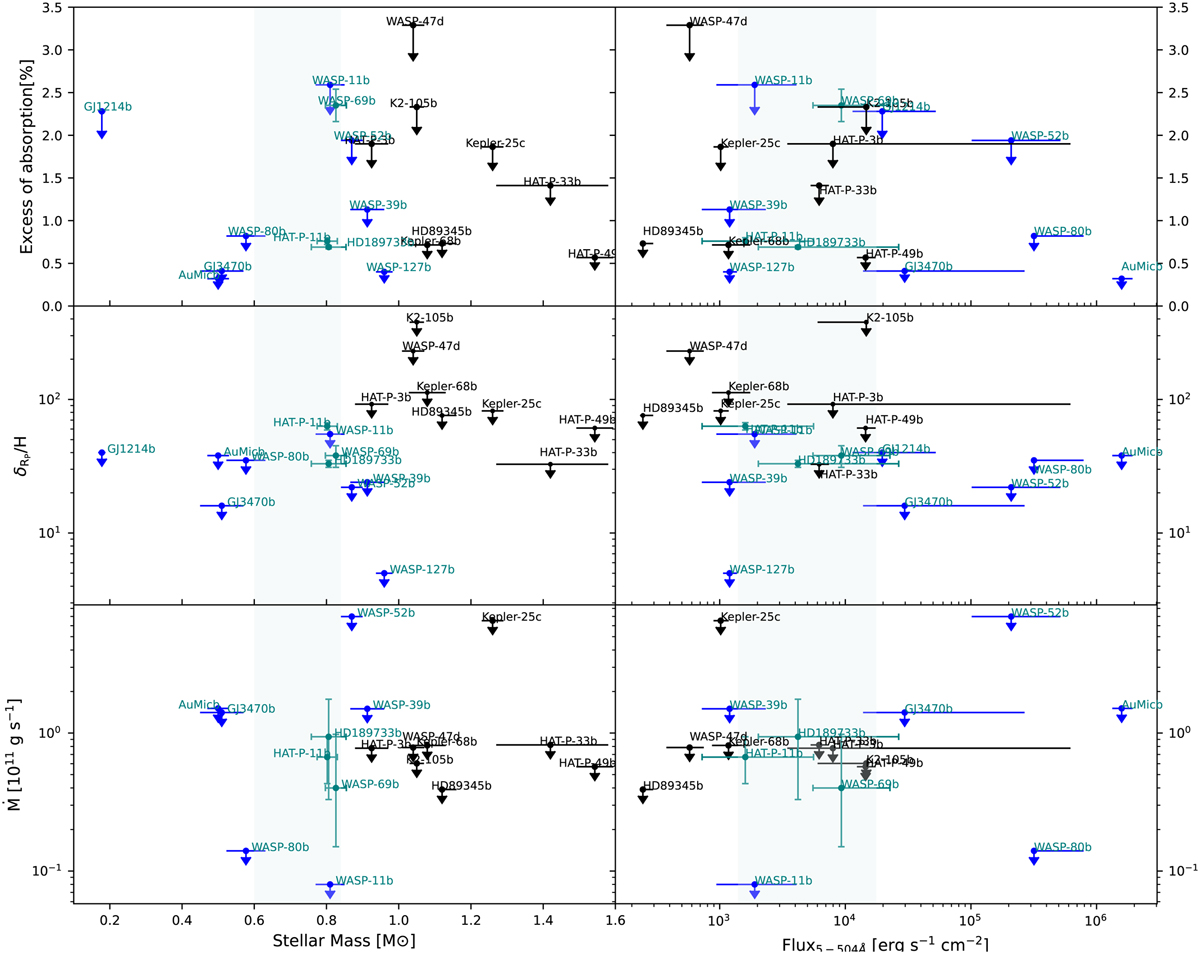
Correlation plots. Excess of absorption (top panels), ![]() (middle panels) and mass-loss rates (bottom panels) as a function of stellar mass and XUV irradiation at the planet position. Upper limits are given at 3σ. Blue stars are targets reported from Allart et al. (2023), the detections and the non-detections are plotted in dark- and light-blue, respectively. We note that K2-105 b observations suffered from GIANO-B’s auto-guide problems and low S/N, so the limit we set on
(middle panels) and mass-loss rates (bottom panels) as a function of stellar mass and XUV irradiation at the planet position. Upper limits are given at 3σ. Blue stars are targets reported from Allart et al. (2023), the detections and the non-detections are plotted in dark- and light-blue, respectively. We note that K2-105 b observations suffered from GIANO-B’s auto-guide problems and low S/N, so the limit we set on ![]() is not constraining. We highlighted in gray the area of the parameter space that accordingly to Allart et al. (2023) seems to favor the detections. The errors on the XUV flux have been calculated with the error on the stellar ages.
is not constraining. We highlighted in gray the area of the parameter space that accordingly to Allart et al. (2023) seems to favor the detections. The errors on the XUV flux have been calculated with the error on the stellar ages.
Current usage metrics show cumulative count of Article Views (full-text article views including HTML views, PDF and ePub downloads, according to the available data) and Abstracts Views on Vision4Press platform.
Data correspond to usage on the plateform after 2015. The current usage metrics is available 48-96 hours after online publication and is updated daily on week days.
Initial download of the metrics may take a while.