Open Access
Fig. 7
Download original image
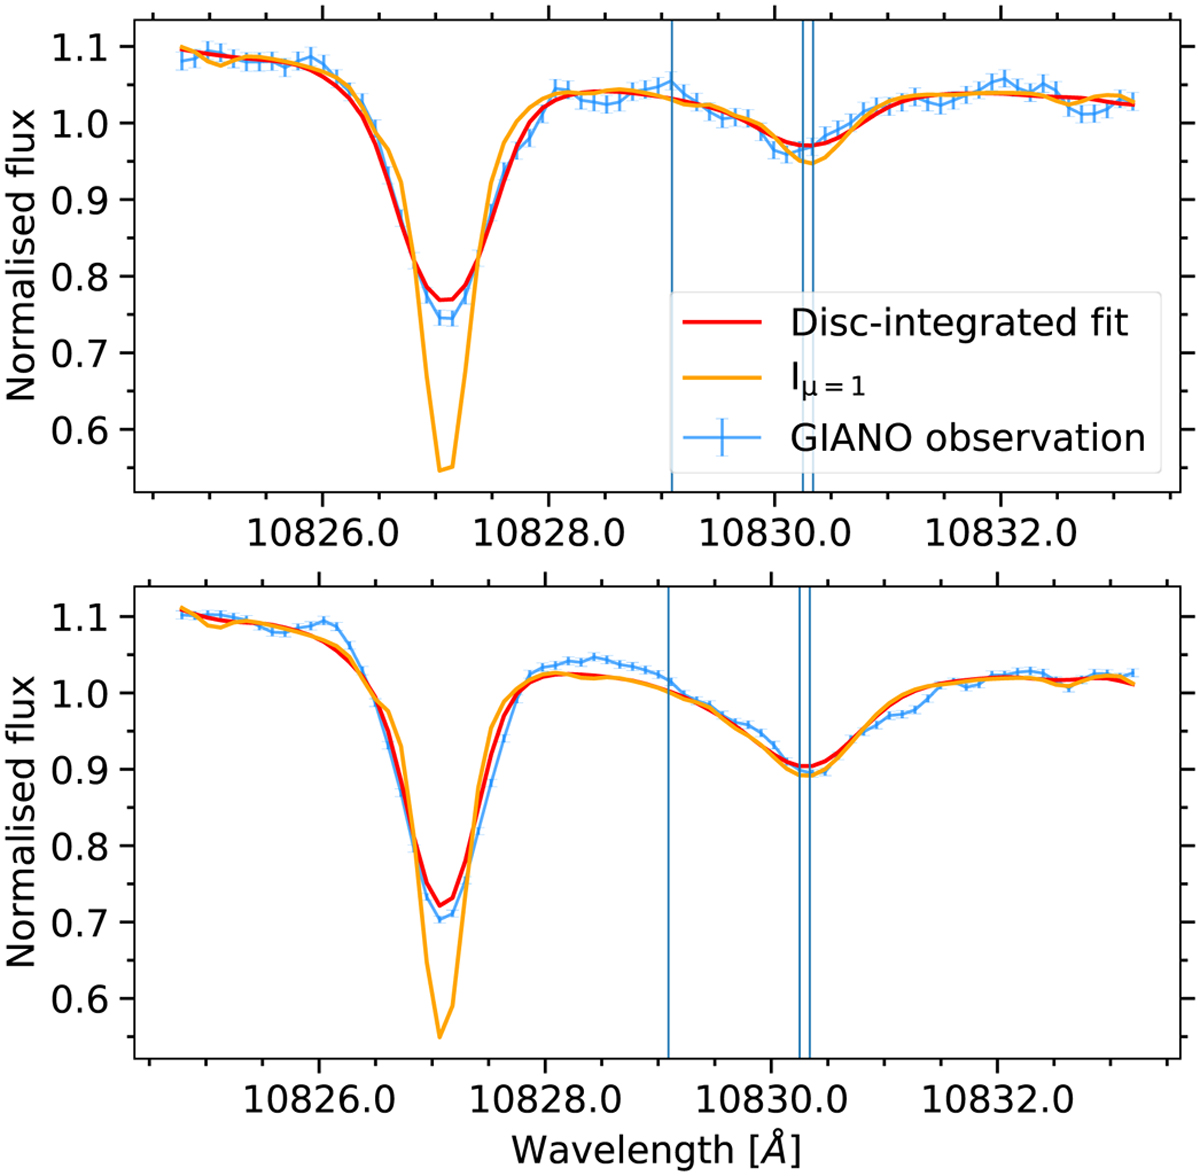
Normalized spectra of HAT-P-33 (upper panel) and HAT-P-49 (lower panel). We show the best fit (red curve) to the observed (blue curve) disk-integrated spectrum, and the spectrum at the disk’s center (orange curve). The blue vertical lines show the transition wavelength of the He I triplet.
Current usage metrics show cumulative count of Article Views (full-text article views including HTML views, PDF and ePub downloads, according to the available data) and Abstracts Views on Vision4Press platform.
Data correspond to usage on the plateform after 2015. The current usage metrics is available 48-96 hours after online publication and is updated daily on week days.
Initial download of the metrics may take a while.