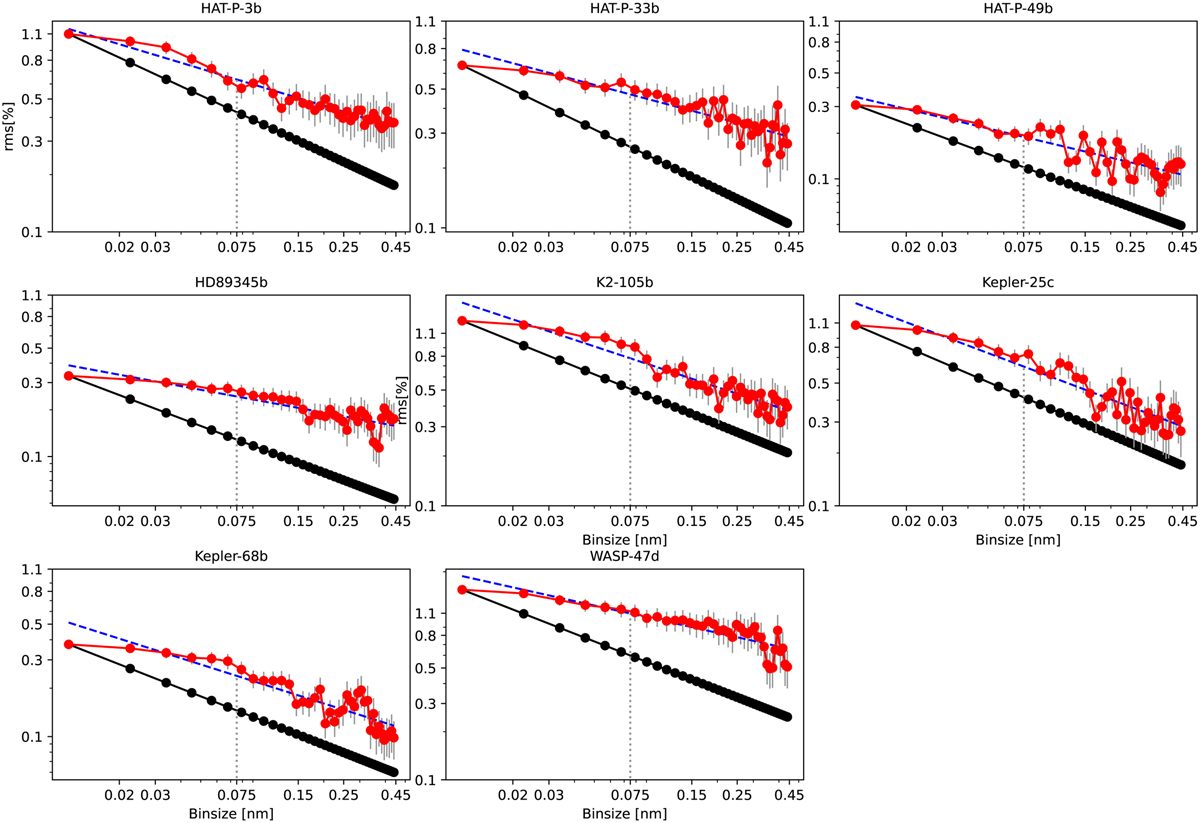
Fig. A.4
Download original image
Allan plot computed on the average transmission spectra. The back lines are the expected rms for white noise (which scales with the number of points for bin). The red dotted curves are the standard deviation of the transmission spectrum after various binning of different bin size. The dashed blue lines are the best fit for the red curves (computed in log-log scale). The vertical gray lines are the derived 1σ uncertainty at 0.075 nm. The error bars denote this 1σuncertainty of the rms (Cubillos et al. 2017).
Current usage metrics show cumulative count of Article Views (full-text article views including HTML views, PDF and ePub downloads, according to the available data) and Abstracts Views on Vision4Press platform.
Data correspond to usage on the plateform after 2015. The current usage metrics is available 48-96 hours after online publication and is updated daily on week days.
Initial download of the metrics may take a while.