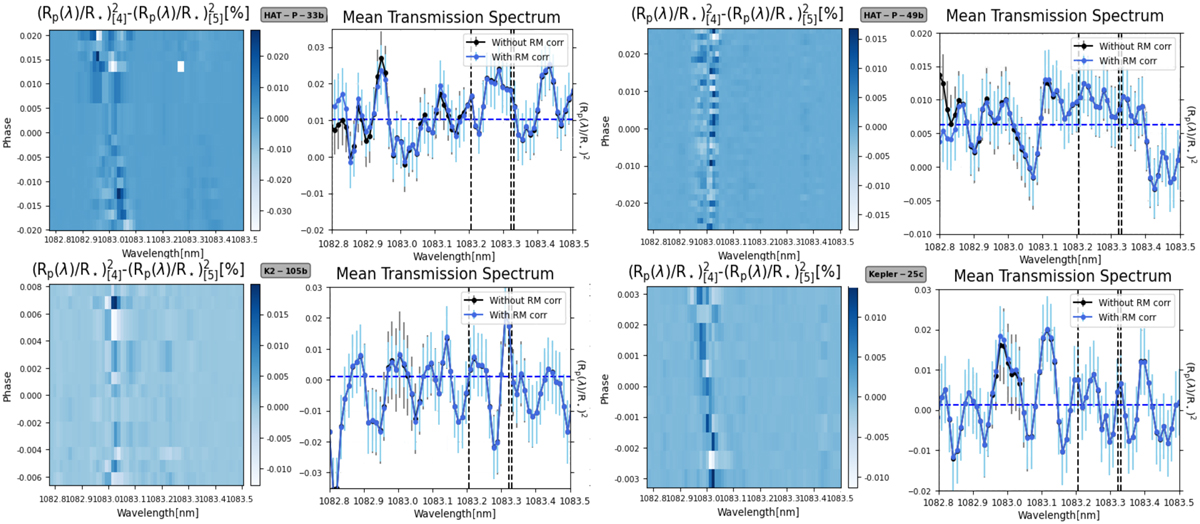
Fig. A3
Download original image
Difference between the full in-transit transmission spectra in stellar rest frame when both accounting and not accounting for the RM effects (left panel). Average full in-transit transmission spectrum in the planet rest frame when both accounting (blue line) and not accounting (black line) for the RM effect (right panel). Left panels also show the difference between the transmission spectra calculated with formula 3, with the RM correction, and 4, no RM correction applied, in the stellar rest frame. The RM signal creates a signature that is comparable to the dispersion in a given transmission spectrum and furthermore smoothes out when averaging over the transit because the RM signature shifts along the transit chord radial velocities.
Current usage metrics show cumulative count of Article Views (full-text article views including HTML views, PDF and ePub downloads, according to the available data) and Abstracts Views on Vision4Press platform.
Data correspond to usage on the plateform after 2015. The current usage metrics is available 48-96 hours after online publication and is updated daily on week days.
Initial download of the metrics may take a while.