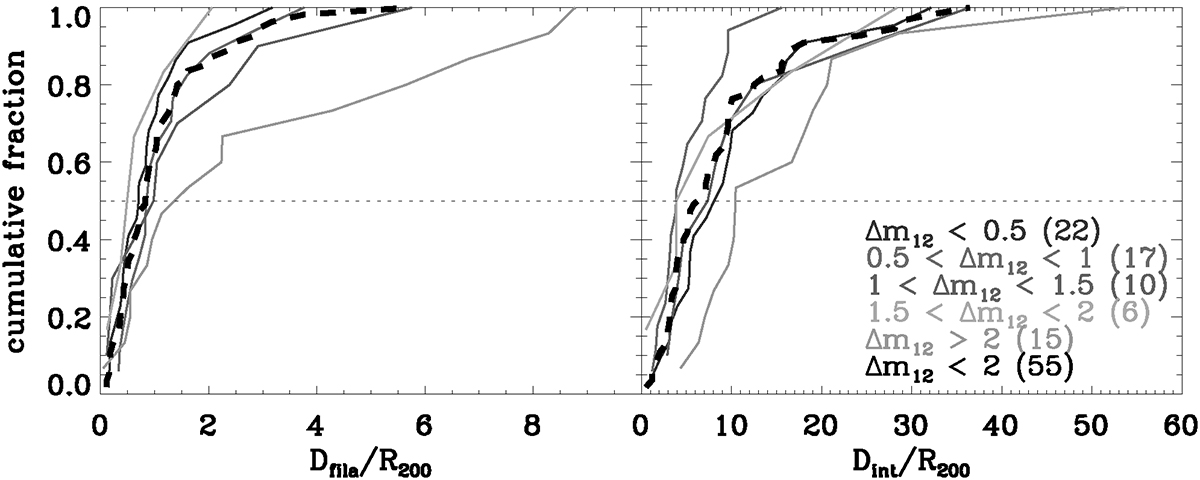
Fig. 3.
Download original image
Cumulative distributions of distances from filaments (left panel) and intersections (right panel). Blue lines mark the systems with Δm12 < 0.5 mag, red lines systems with 0.5 ≤ Δm12 < 1.0 mag, green lines systems with 1.0 ≤ Δm12 < 1.5 mag, and orange lines systems with 1.5 ≤ Δm12 < 2.0 mag. In both panels, the dashed black line is the cumulative distribution for all non-FG systems (Δm12 < 2.0), while the violet line corresponds to FGs (Δm12 ≥ 2.0 mag). The numbers within parentheses indicate the size of the samples for each cumulative function. The horizontal dashed line indicates the 50 percentile of the distributions.
Current usage metrics show cumulative count of Article Views (full-text article views including HTML views, PDF and ePub downloads, according to the available data) and Abstracts Views on Vision4Press platform.
Data correspond to usage on the plateform after 2015. The current usage metrics is available 48-96 hours after online publication and is updated daily on week days.
Initial download of the metrics may take a while.