Open Access
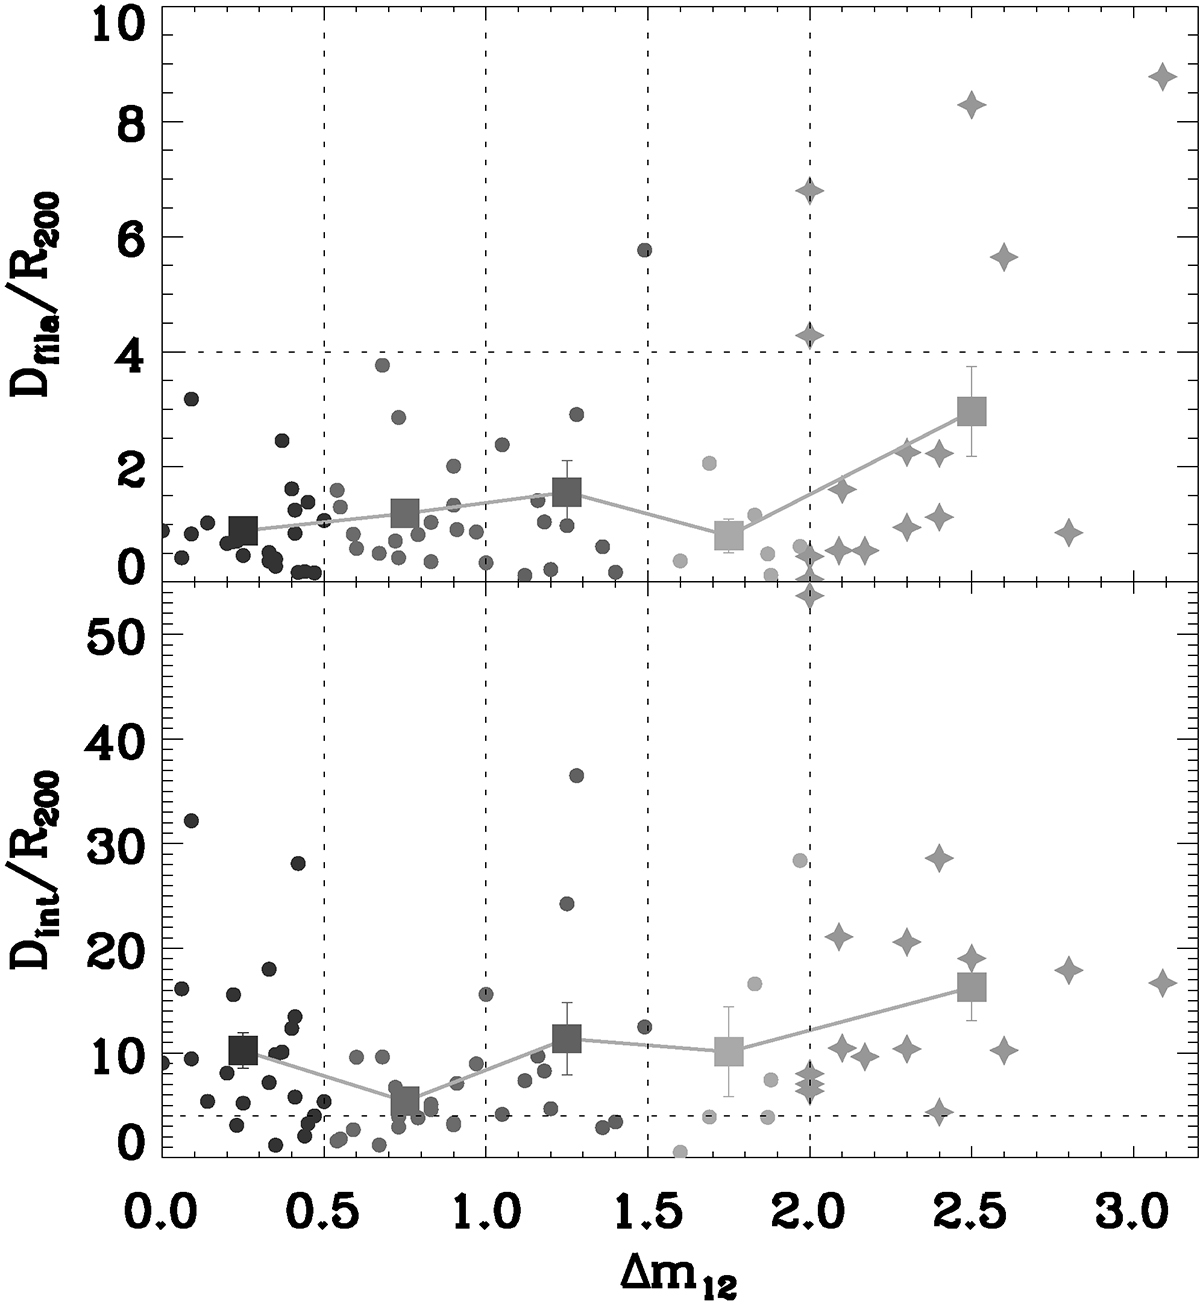
Fig. 2.
Download original image
Minimum distance to the filaments (top panel) and intersections (bottom panel) as a function of the magnitude gap. The larger symbols correspond to the average values of the different magnitude gap intervals as listed in Table 1. The horizontal dashed line in both panels indicates the distance of 4 R200.
Current usage metrics show cumulative count of Article Views (full-text article views including HTML views, PDF and ePub downloads, according to the available data) and Abstracts Views on Vision4Press platform.
Data correspond to usage on the plateform after 2015. The current usage metrics is available 48-96 hours after online publication and is updated daily on week days.
Initial download of the metrics may take a while.