Open Access
Fig. 8
Download original image
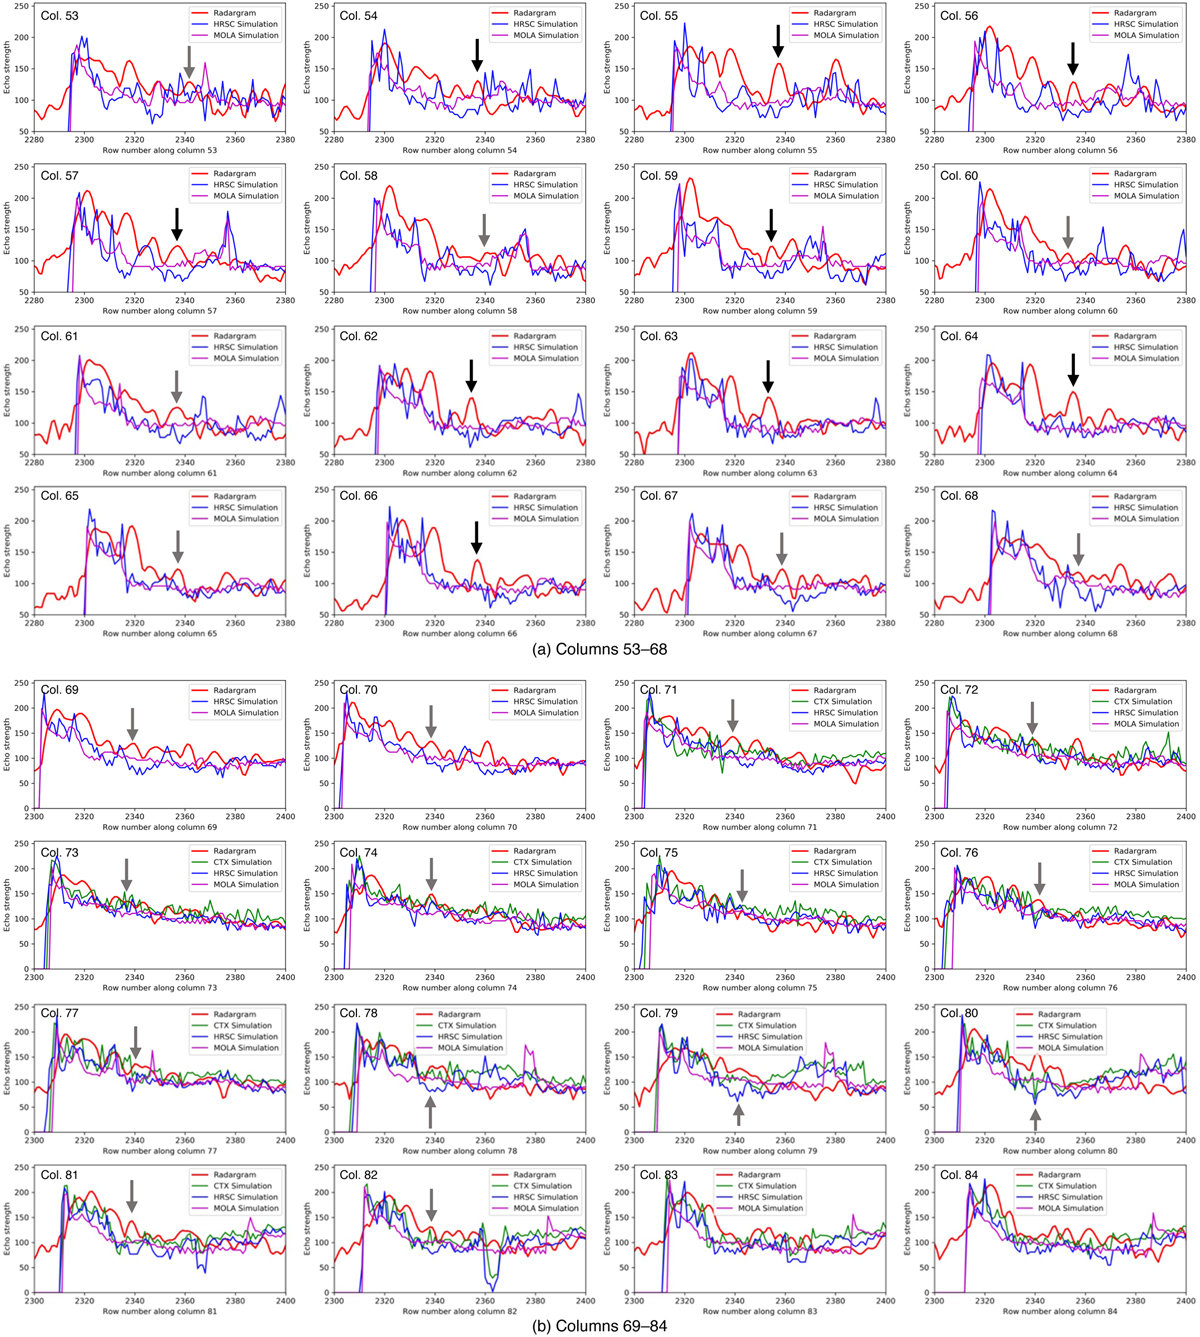
Radar reflections and simulations along (a) Cols. 53–68 and (b) Cols. 69–84 of the selected radargram (PID: 05594002), with the black and grey arrows pointing to the echoes caused by the possible subsurface layer, which corresponds to the area highlighted with the green arrow in Fig. 6 and the green oval in Fig. 7.
Current usage metrics show cumulative count of Article Views (full-text article views including HTML views, PDF and ePub downloads, according to the available data) and Abstracts Views on Vision4Press platform.
Data correspond to usage on the plateform after 2015. The current usage metrics is available 48-96 hours after online publication and is updated daily on week days.
Initial download of the metrics may take a while.