Fig. 7
Download original image
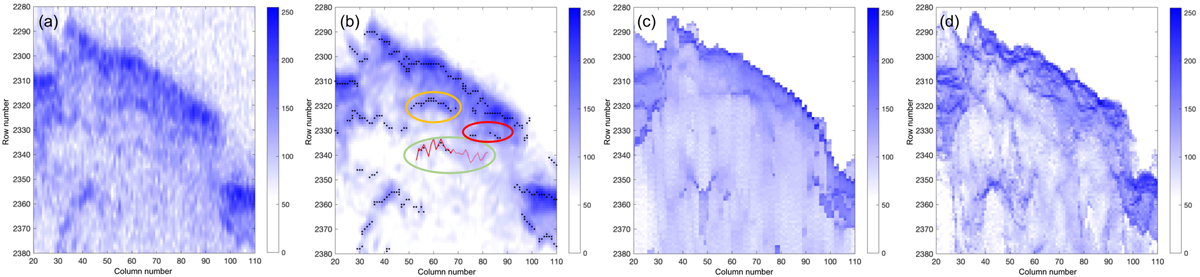
Close-up view of the area of interest from (a) the original radargram with normalised echo strength, (b) the radargram with the log-Gabor filter applied, (c) the MOLA cluttergram, and (d) the HRSC cluttergram. The red, yellow, and green ovals show each of the three sets of unusual subsurface layers. In the green oval, the red solid line spans from Cols. 53 to 68, and the red dotted line ranges from Cols. 69 to 82.
Current usage metrics show cumulative count of Article Views (full-text article views including HTML views, PDF and ePub downloads, according to the available data) and Abstracts Views on Vision4Press platform.
Data correspond to usage on the plateform after 2015. The current usage metrics is available 48-96 hours after online publication and is updated daily on week days.
Initial download of the metrics may take a while.