Fig. 5
Download original image
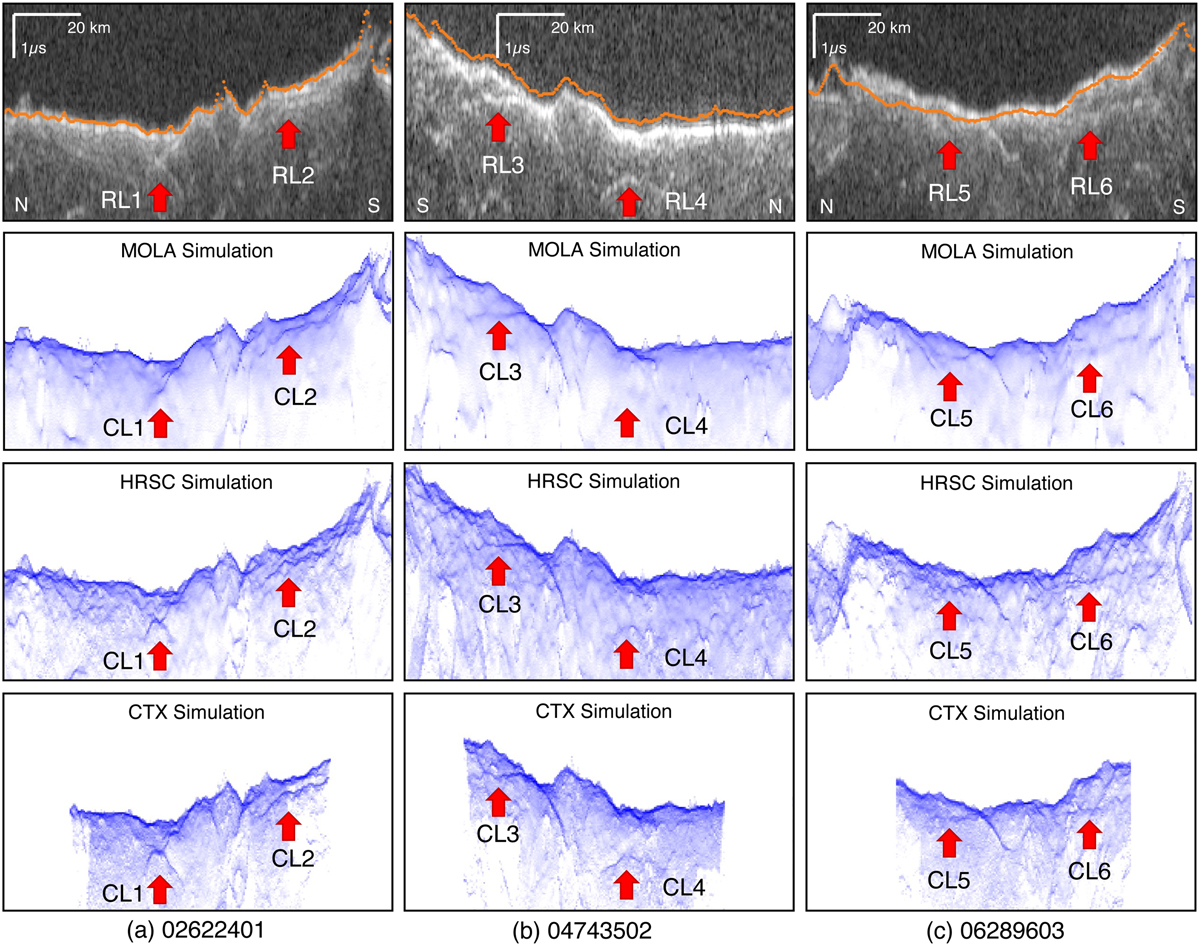
Comparison between clutter simulations based on MOLA, HRSC MADNet and CTX MADNet DTMs. Resultant simulations along the SHARAD observations: (a) 02622401; (b) 04743502 and (c) 06829603. RL1–6 are radar reflectors and CL1–6 point to the location of corresponding clutters. The orange dots in the first-row subfigures are projections of nadir surface to the radargram coordinate.
Current usage metrics show cumulative count of Article Views (full-text article views including HTML views, PDF and ePub downloads, according to the available data) and Abstracts Views on Vision4Press platform.
Data correspond to usage on the plateform after 2015. The current usage metrics is available 48-96 hours after online publication and is updated daily on week days.
Initial download of the metrics may take a while.