Fig. 7.
Download original image
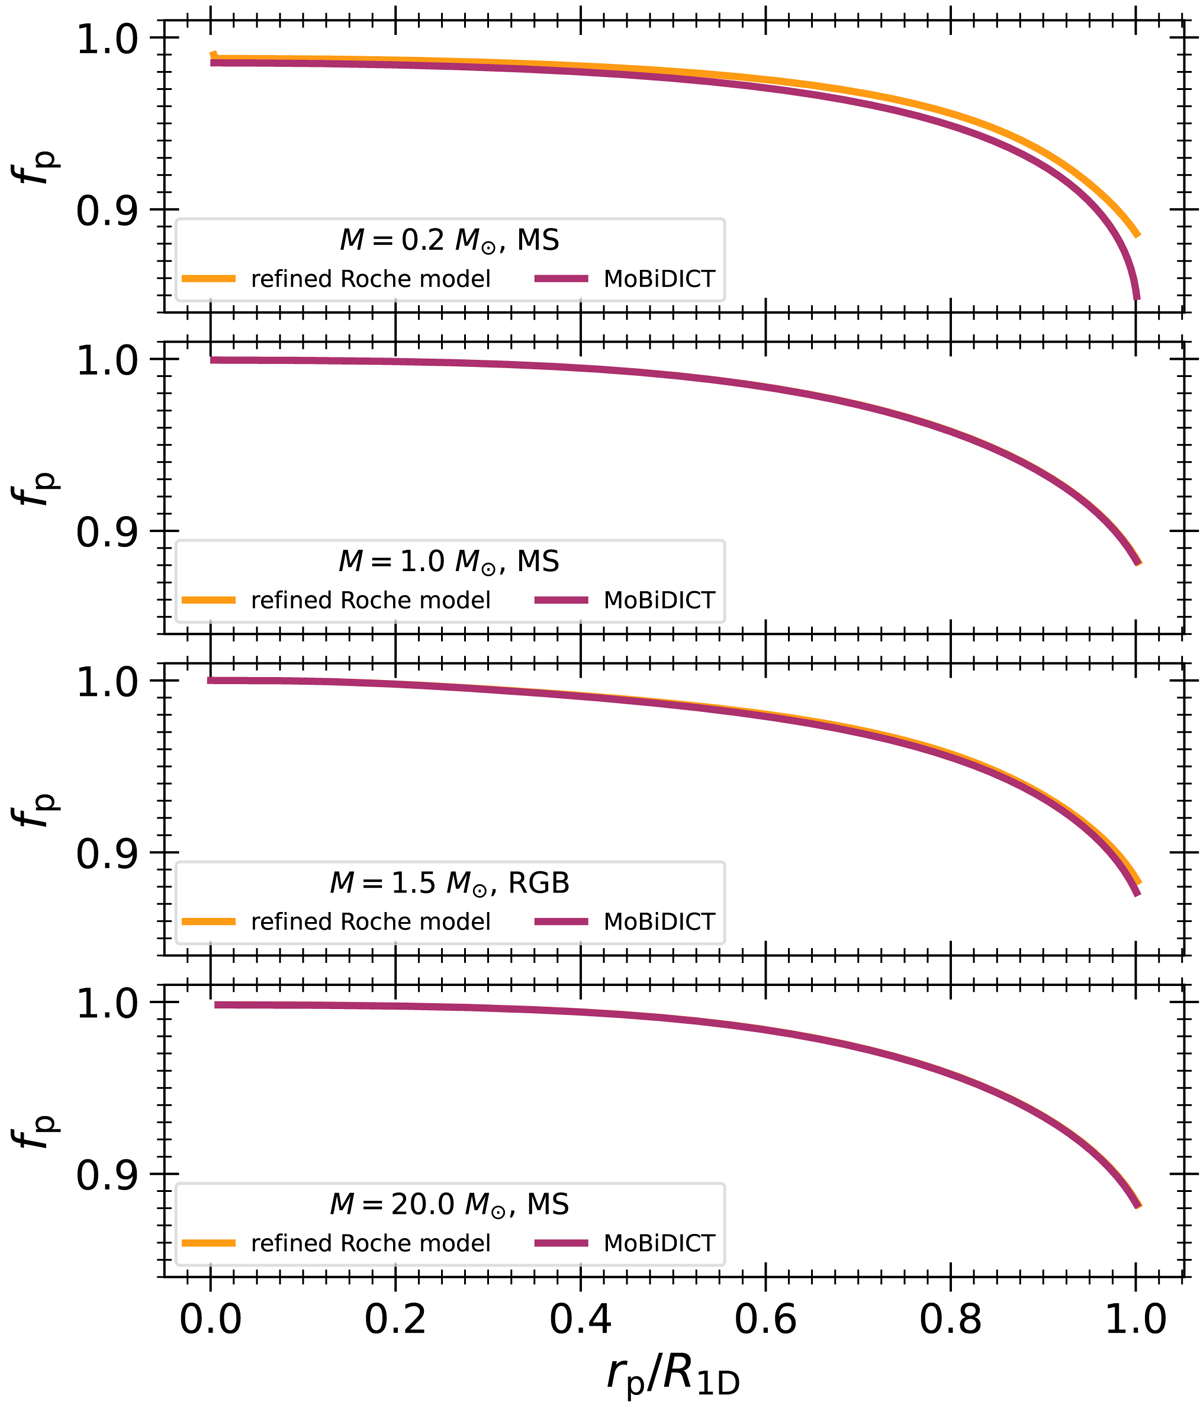
Evolution of fp as a function of the radius of stars in twin binary systems for the different models compared. From top to bottom, each panel respectively represents fp for the 0.2, 1.0, 1.5 and 20.0 M⊙ stars in twin binary systems. The orange curves are the results with our refined Roche model while the purple curves are the results from MoBiDICT.
Current usage metrics show cumulative count of Article Views (full-text article views including HTML views, PDF and ePub downloads, according to the available data) and Abstracts Views on Vision4Press platform.
Data correspond to usage on the plateform after 2015. The current usage metrics is available 48-96 hours after online publication and is updated daily on week days.
Initial download of the metrics may take a while.