Fig. 2.
Download original image
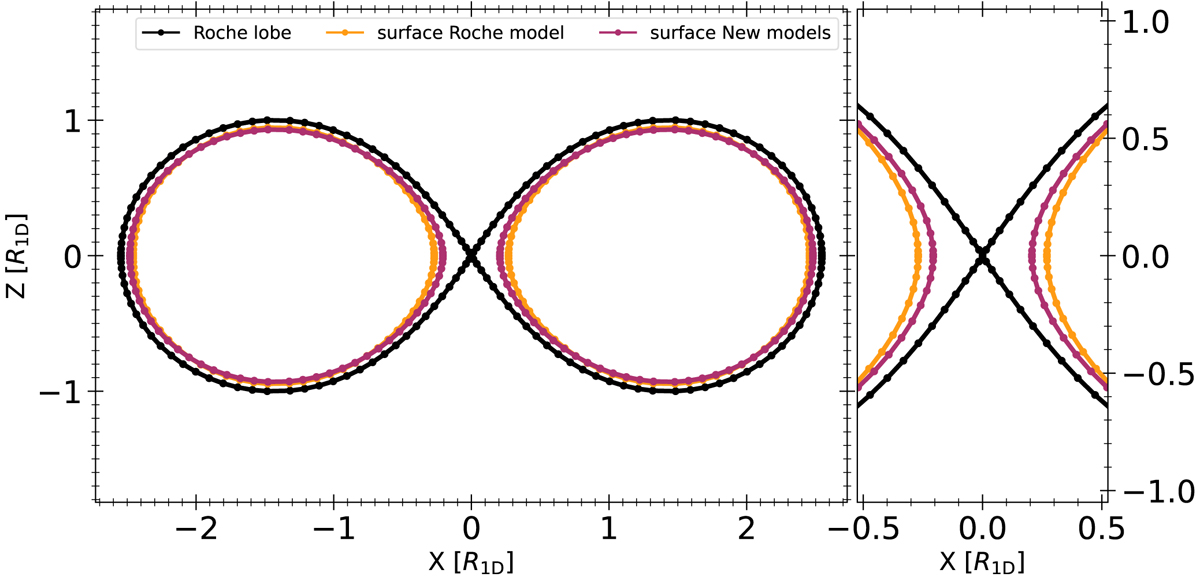
Surface deformation of the twin binary system of our 0.2 M⊙ stars with a separation of 2.8 R1D (corresponding to a period of 2 h and 11 min) as viewed from the side of the system. The black curve corresponds to the Roche lobe of the system, the yellow curve is the surface of each star given by the Roche model while the purple curve corresponds to the surface of each star given by the modelling with MoBiDICT. In this particular case, the filling of the Roche lobes is of 81.7% with each model.
Current usage metrics show cumulative count of Article Views (full-text article views including HTML views, PDF and ePub downloads, according to the available data) and Abstracts Views on Vision4Press platform.
Data correspond to usage on the plateform after 2015. The current usage metrics is available 48-96 hours after online publication and is updated daily on week days.
Initial download of the metrics may take a while.