Fig. 3.
Download original image
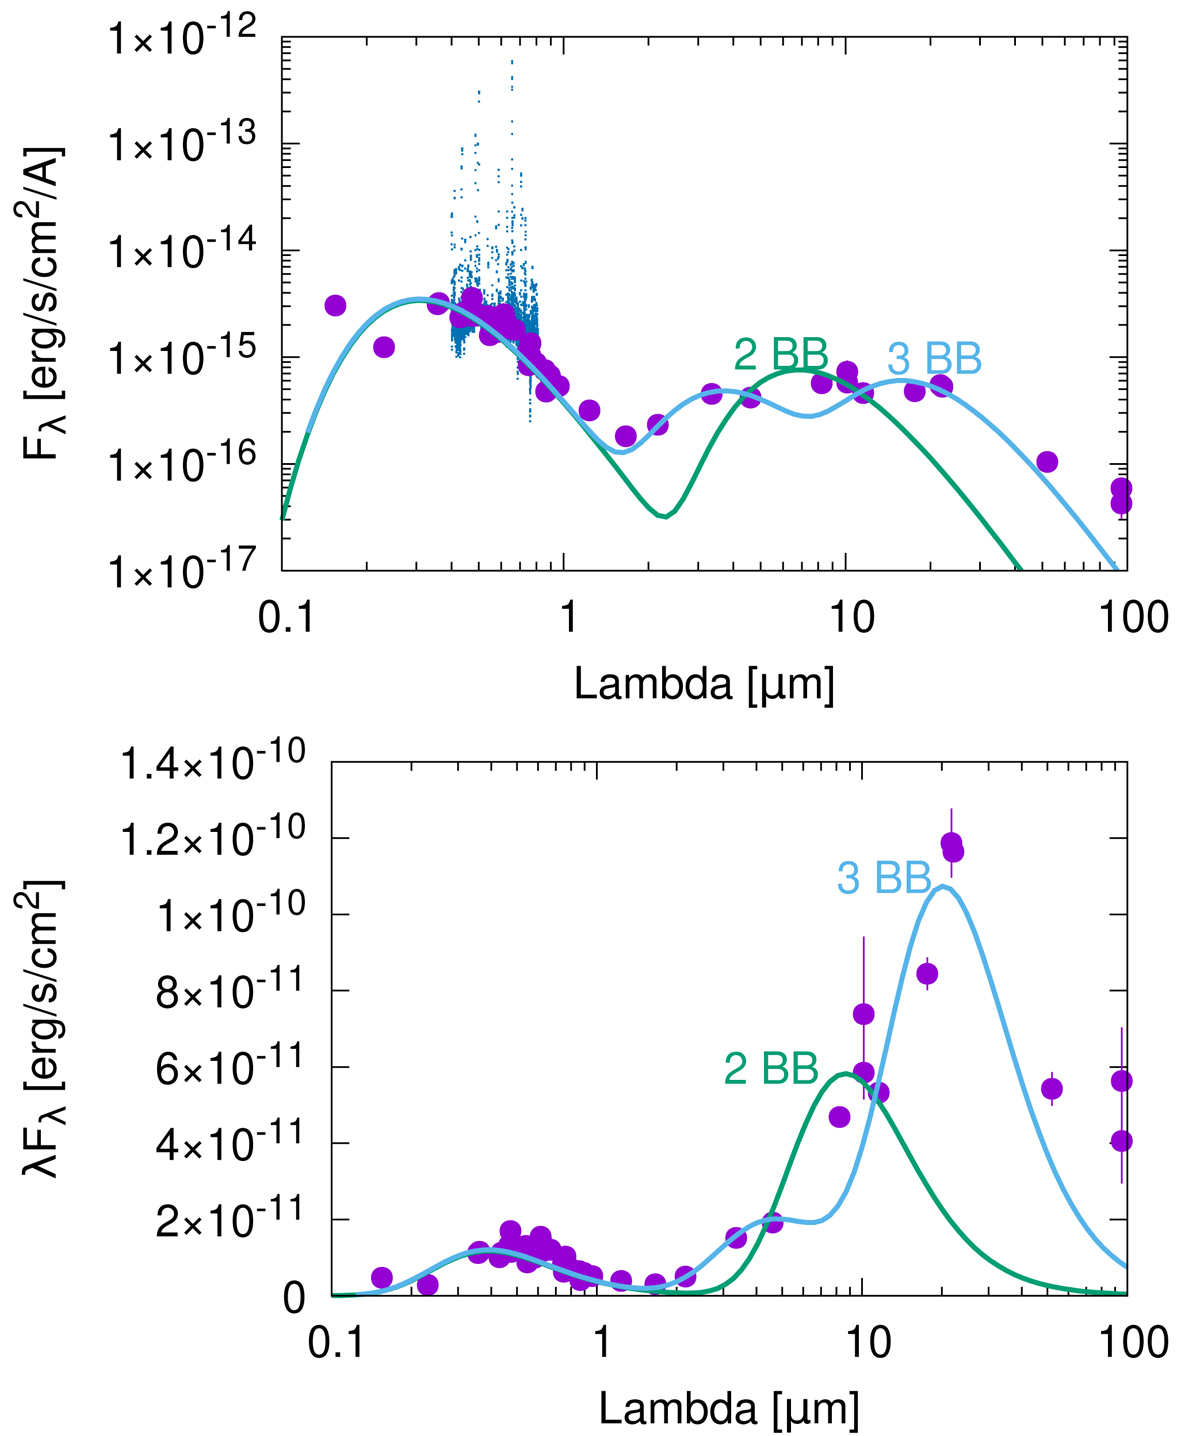
SED of PM 1-322. Top: representation in log–log scale that clearly indicates an IR excess. Bottom: λFλ representation that demonstrates that most of the energy is in fact radiated at IR wavelengths. Observations are indicated by the purple circles with error-bars. The green and blue lines denote, respectively, a simple two black-body fit and a three black-body fit to the data. The small dark-blue points in the upper plot represent a smoothed flux calibrated spectrum from Sect. 6.1.
Current usage metrics show cumulative count of Article Views (full-text article views including HTML views, PDF and ePub downloads, according to the available data) and Abstracts Views on Vision4Press platform.
Data correspond to usage on the plateform after 2015. The current usage metrics is available 48-96 hours after online publication and is updated daily on week days.
Initial download of the metrics may take a while.