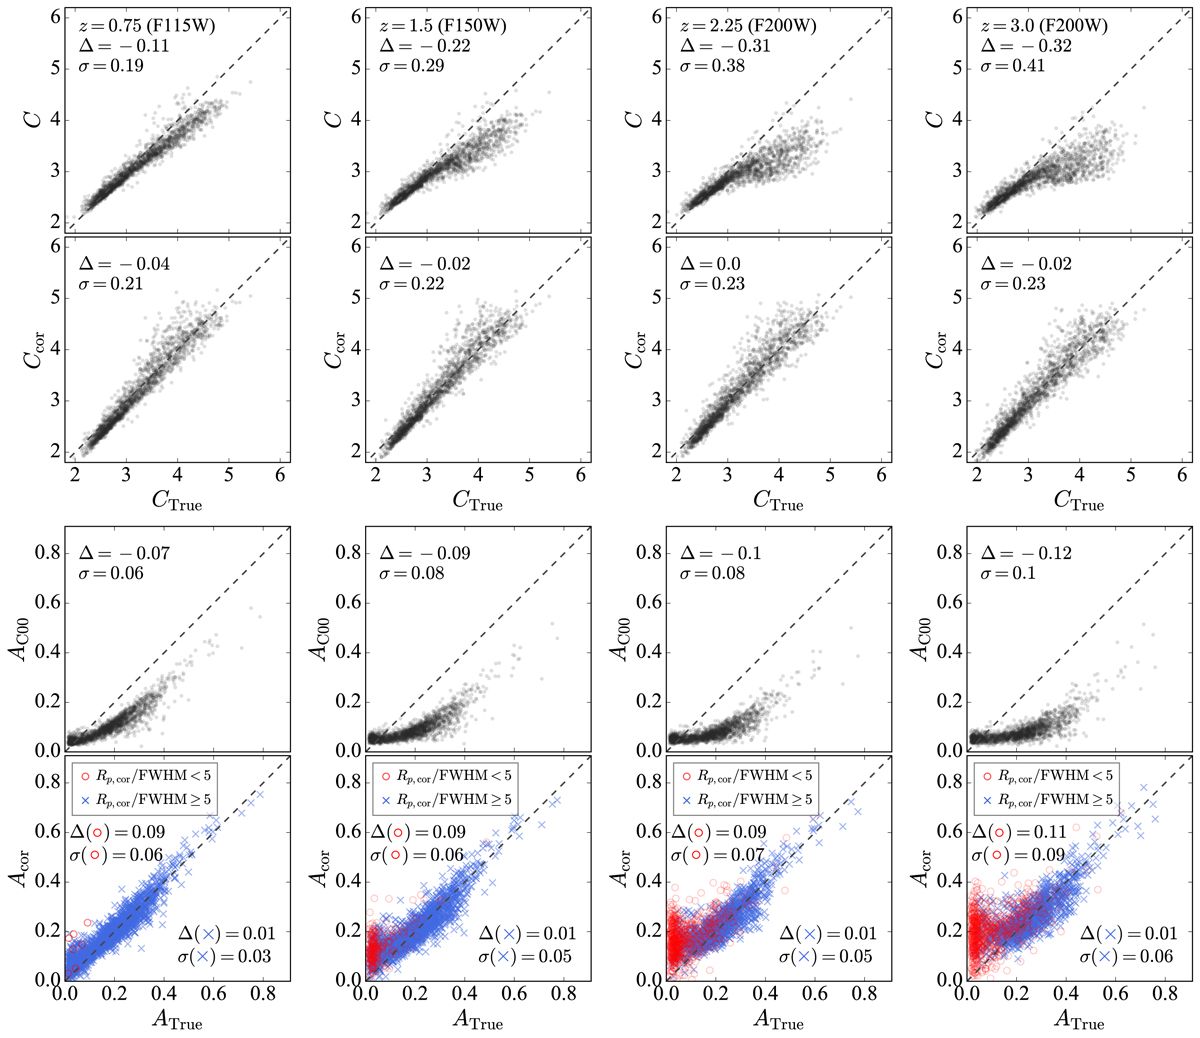
Fig. 16.
Download original image
Evaluation of the effectiveness of the correction functions in reproducing the intrinsic concentration and asymmetry. The top two rows present comparisons of the concentration measured from simulated CEERS images (C), bias-corrected values (Ccor), and intrinsic values (CTrue). The bottom two rows illustrate comparisons of asymmetry measured from simulated CEERS images using the conventional method (AC00), bias-corrected values (Acor), and intrinsic values (ATrue). Columns one through four show results for z = 0.75, 1.5, 2.25, and 3.0, respectively. The mean difference (Δ) and scatter (σ) between the y-axis and x-axis values are indicated at the top of each panel. In the ATrue − Acor relations, data are divided into two groups: angularly small galaxies with Rp, True/FWHM < 5 (red circles) and angularly large galaxies with Rp, cor/FWHM ≥ 5 (blue crosses).
Current usage metrics show cumulative count of Article Views (full-text article views including HTML views, PDF and ePub downloads, according to the available data) and Abstracts Views on Vision4Press platform.
Data correspond to usage on the plateform after 2015. The current usage metrics is available 48-96 hours after online publication and is updated daily on week days.
Initial download of the metrics may take a while.