Fig. 15.
Download original image
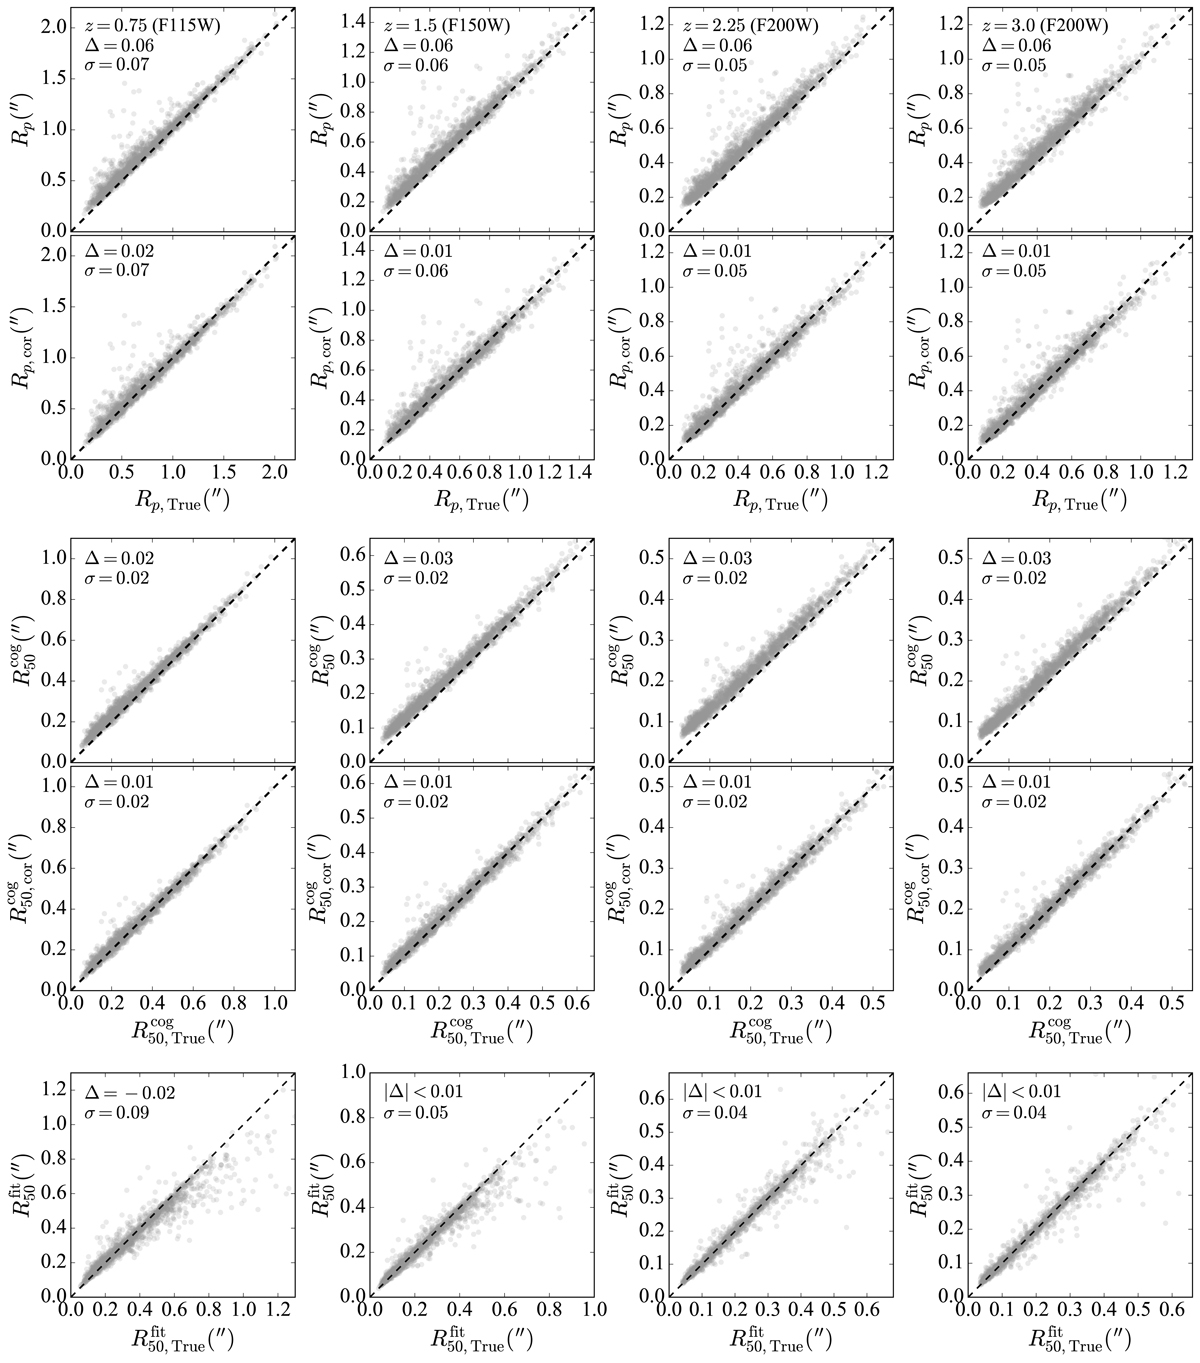
Comparison of galaxy sizes measured from simulated CEERS images, bias-corrected sizes, and intrinsic sizes. The top two rows present results for Petrosian radius (Rp). The middle two rows present results for half-light radius obtained through non-parametric method (![]() ). The bottom row presents results for half-light radius obtained through Sérsic fitting (
). The bottom row presents results for half-light radius obtained through Sérsic fitting (![]() ), with no correction applied. The mean difference (Δ) and scatter (σ) between the x-axis and y-axis values are indicated at the top of each panel. Columns one through four show results for z = 0.75, 1.5, 2.25, and 3.0, respectively.
), with no correction applied. The mean difference (Δ) and scatter (σ) between the x-axis and y-axis values are indicated at the top of each panel. Columns one through four show results for z = 0.75, 1.5, 2.25, and 3.0, respectively.
Current usage metrics show cumulative count of Article Views (full-text article views including HTML views, PDF and ePub downloads, according to the available data) and Abstracts Views on Vision4Press platform.
Data correspond to usage on the plateform after 2015. The current usage metrics is available 48-96 hours after online publication and is updated daily on week days.
Initial download of the metrics may take a while.