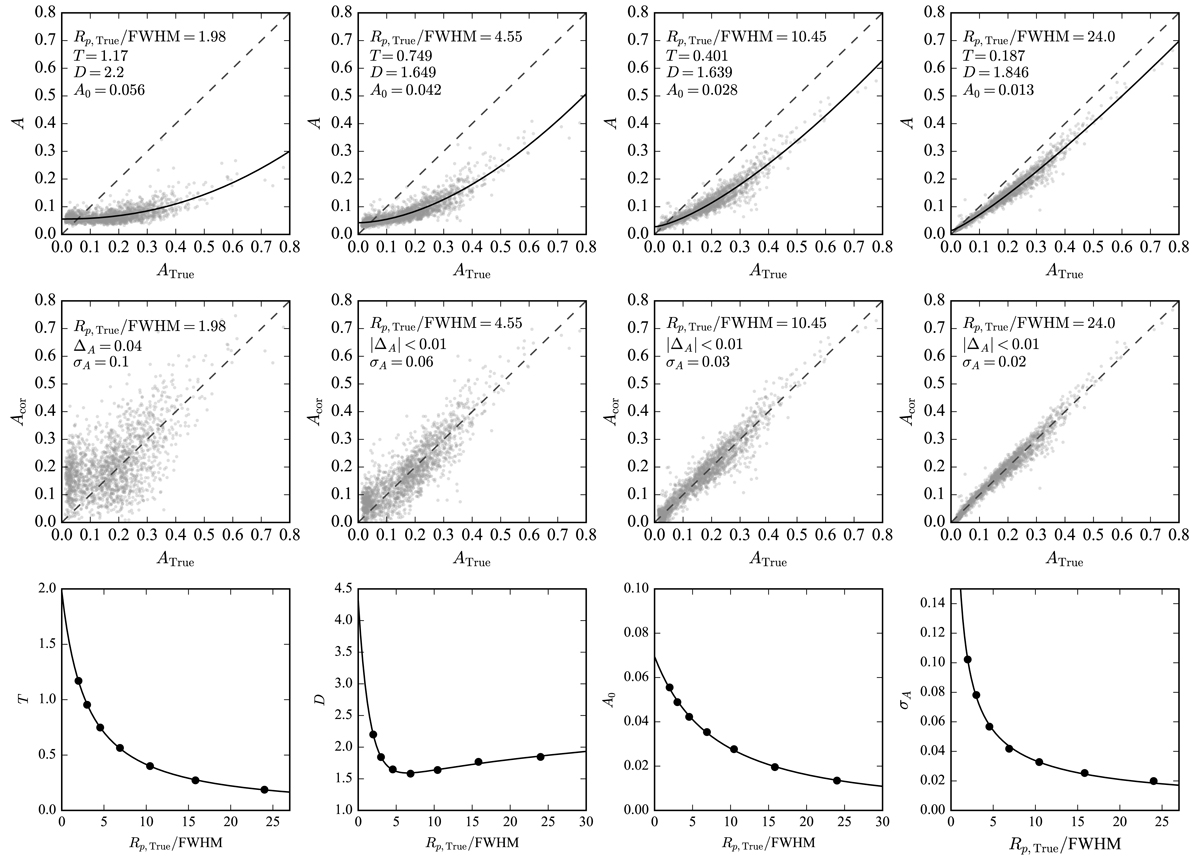
Fig. 12.
Download original image
Evaluation of bias and uncertainty due to resolution effects in measuring asymmetry (A). Top row shows the correlation between A values obtained from the N-FWHM images and their intrinsic values (ATrue), with the solid curve representing the best-fit function. Middle row displays the correlation between bias-corrected asymmetries (Acor) and ATrue. Bottom row presents the parameters (T, D, and A0) and the uncertainty in correcting A (σA), as a function of Rp, True/FWHM, with the curve marking their best-fit functions.
Current usage metrics show cumulative count of Article Views (full-text article views including HTML views, PDF and ePub downloads, according to the available data) and Abstracts Views on Vision4Press platform.
Data correspond to usage on the plateform after 2015. The current usage metrics is available 48-96 hours after online publication and is updated daily on week days.
Initial download of the metrics may take a while.