Fig. 11.
Download original image
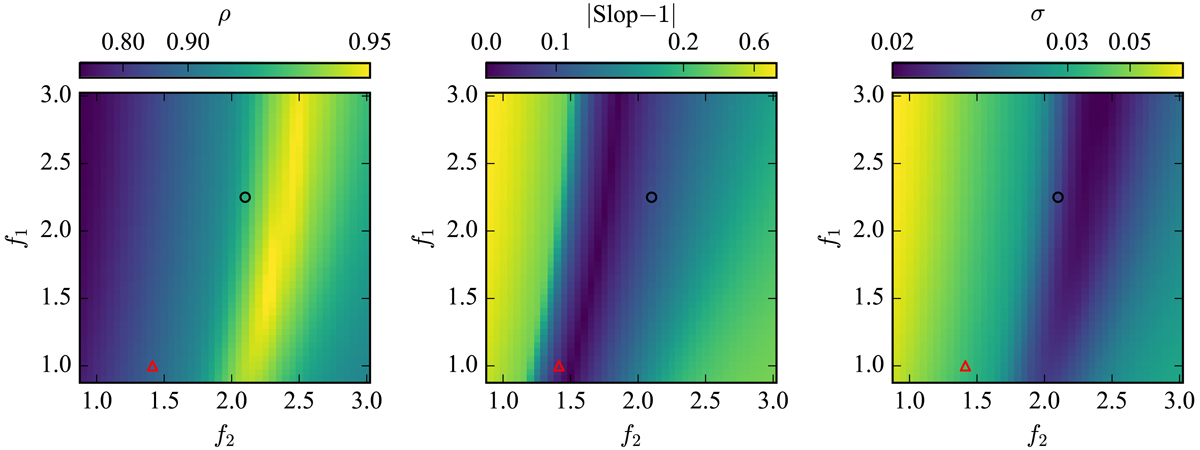
Pearson correlation coefficient (ρ), absolute difference between the slop and unity (|slop − 1|), and scatter (σ) between asymmetry calculated using Eq. (28) and Anoise-free as a function of f1 and f2. The values are color-encoded using histogram equalization scale. The black circle marks the optimal f1 = 2.25 and f2 = 2.1 we determine empirically, while the red triangle marks the f1 = 1 and ![]() , as suggested in Wen & Zheng (2016).
, as suggested in Wen & Zheng (2016).
Current usage metrics show cumulative count of Article Views (full-text article views including HTML views, PDF and ePub downloads, according to the available data) and Abstracts Views on Vision4Press platform.
Data correspond to usage on the plateform after 2015. The current usage metrics is available 48-96 hours after online publication and is updated daily on week days.
Initial download of the metrics may take a while.