Fig. 8
Download original image
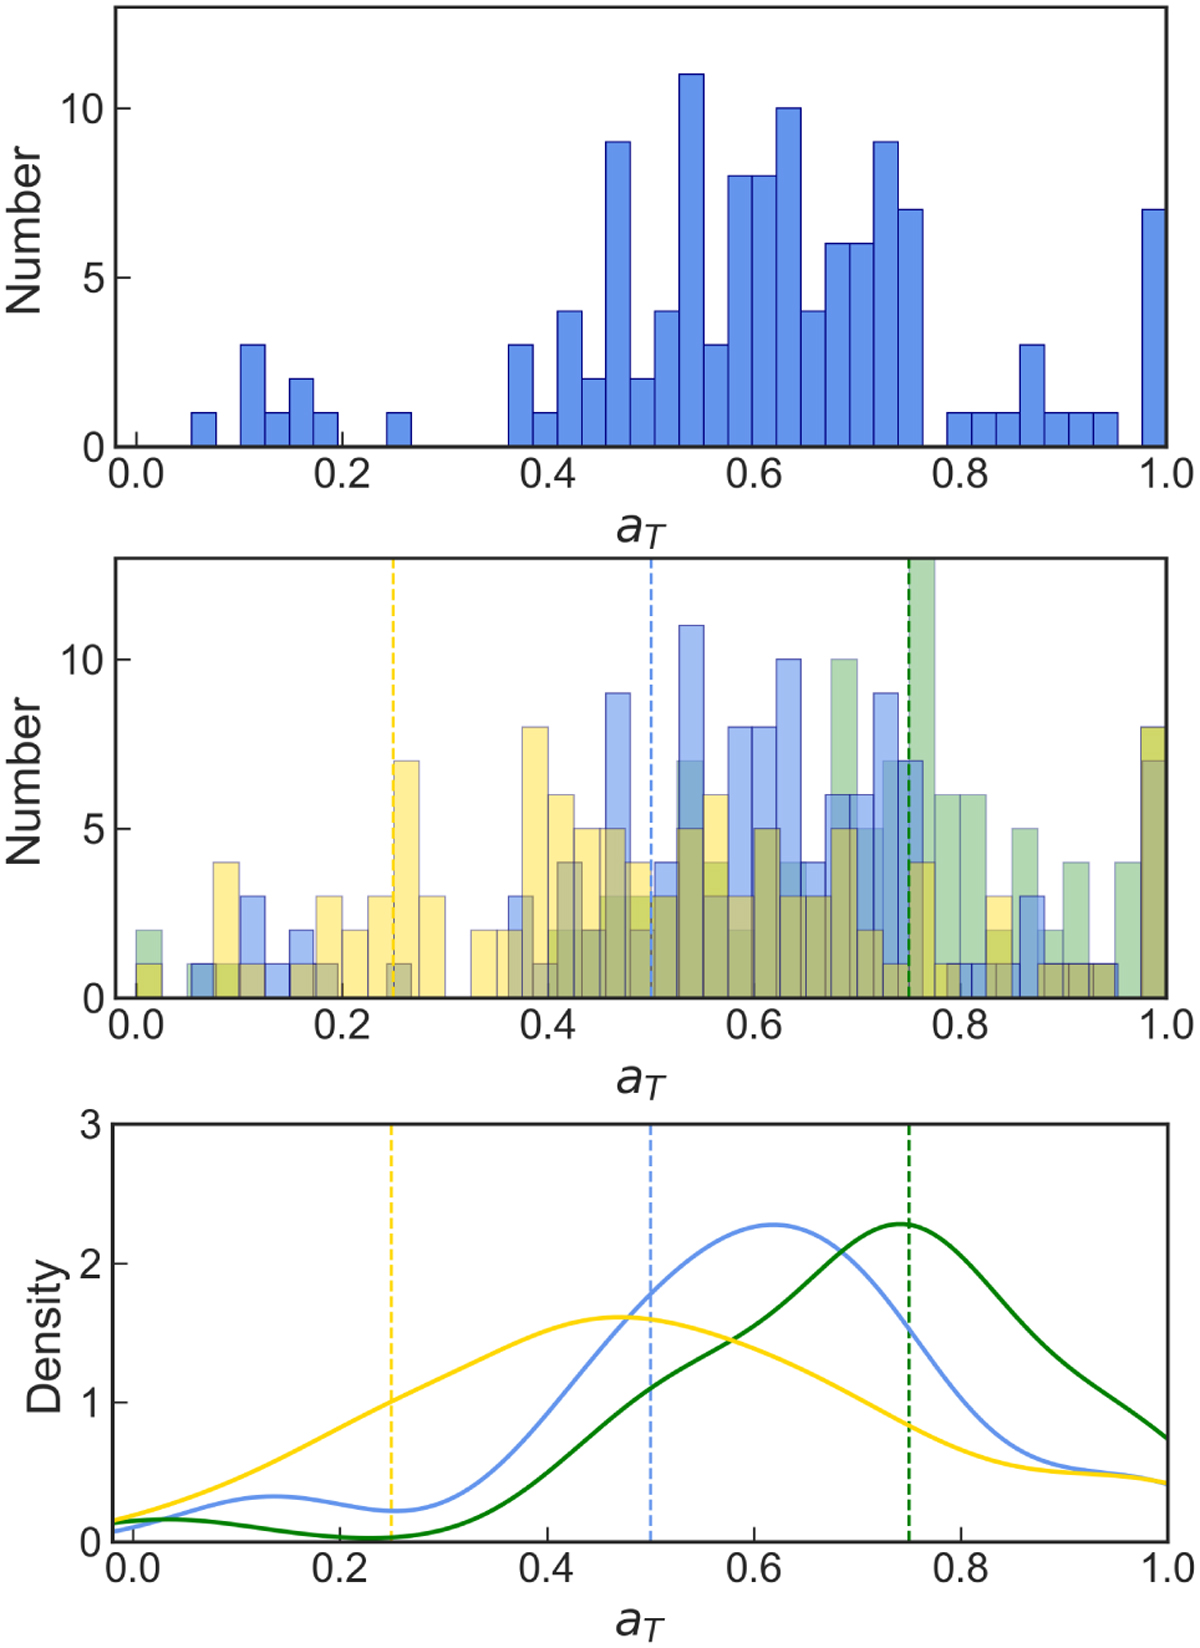
Results of the inference of the tangential component of macro-turbulence. Top panel: Histogram of aT contributions derived from observed profiles of the entire sample with aT = 0.5 as an initial assumption, ν sin i varied within errors of ν sin iFT. Middle panel: Histograms of αT contributions derived from observed profiles of the entire sample with different initial assumptions: 0.25 (yellow), 0.5 (blue), 0.75 (green), and ν sin i left to vary freely. Bottom panel: KDE functions for the same data as in the middle panel. Dashed lines mark initial guesses. The fits demonstrate the results are sensitive to the initial guess.
Current usage metrics show cumulative count of Article Views (full-text article views including HTML views, PDF and ePub downloads, according to the available data) and Abstracts Views on Vision4Press platform.
Data correspond to usage on the plateform after 2015. The current usage metrics is available 48-96 hours after online publication and is updated daily on week days.
Initial download of the metrics may take a while.