Fig. 6
Download original image
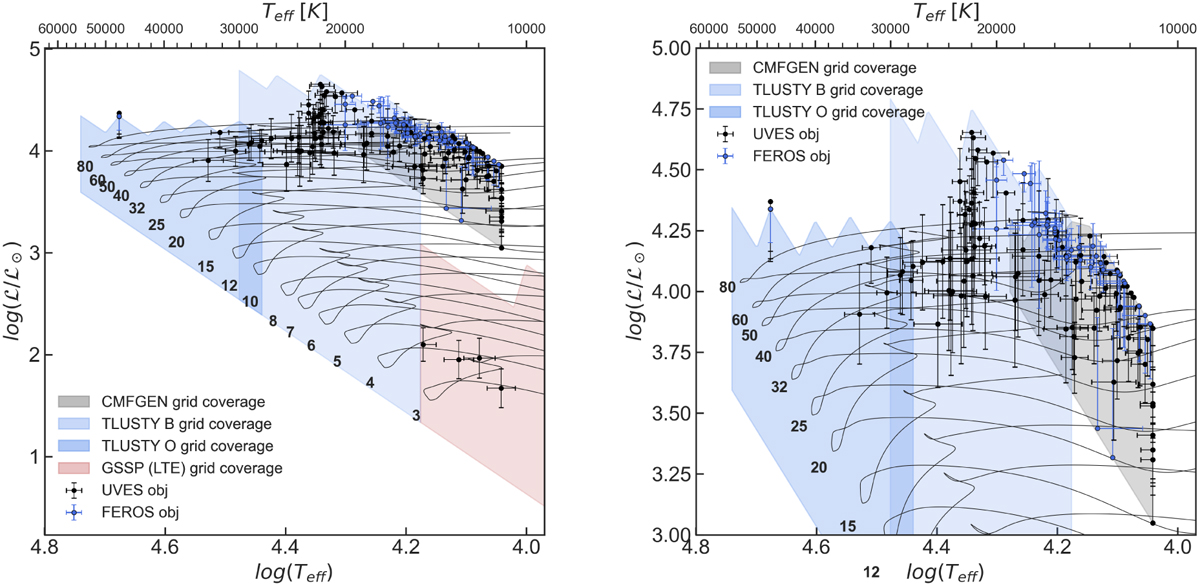
Positions of the sample stars in the spectroscopic log(Teff)–log(ℒ/ℒ⊙) HR diagram. The UVES and FEROS samples are shown with black and blue symbols with error bars, respectively. Regions of the parameter space covered by the GSSP, TLUSTY, and CMFGEN models are marked with red, blue, and grey shaded areas, respectively. Non-rotating mesa stellar evolution tracks computed for Ζ = 0.006 are shown with black solid lines and are taken from Burssens et al. (2020). Left panel: full parameter range. Right panel: zoom onto the high-luminosity region where the bulk of the sample is situated.
Current usage metrics show cumulative count of Article Views (full-text article views including HTML views, PDF and ePub downloads, according to the available data) and Abstracts Views on Vision4Press platform.
Data correspond to usage on the plateform after 2015. The current usage metrics is available 48-96 hours after online publication and is updated daily on week days.
Initial download of the metrics may take a while.