Fig. 5
Download original image
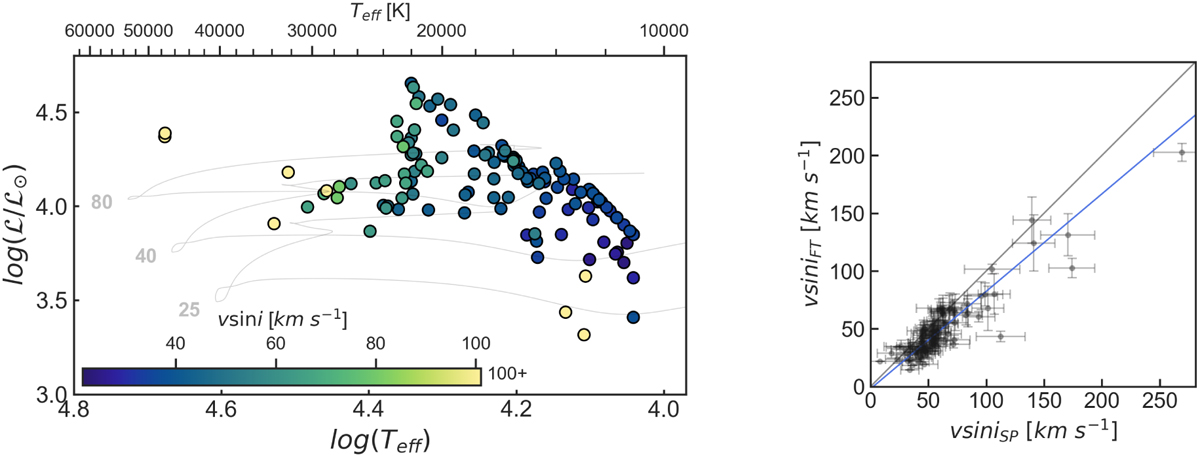
Results of ν sin i inferences. Left panel: positions of the sample stars in the spectroscopic HR diagram. Individual objects are colour coded according to their ν sin i value inferred from the Fourier method. Right panel: comparison of ν sin iSP with ν sin iFT. The grey line shows the case where ν sin iFT and ν sin iSP are equal, while the blue line is an error-weighted fit to the observed values.
Current usage metrics show cumulative count of Article Views (full-text article views including HTML views, PDF and ePub downloads, according to the available data) and Abstracts Views on Vision4Press platform.
Data correspond to usage on the plateform after 2015. The current usage metrics is available 48-96 hours after online publication and is updated daily on week days.
Initial download of the metrics may take a while.