Fig. 10
Download original image
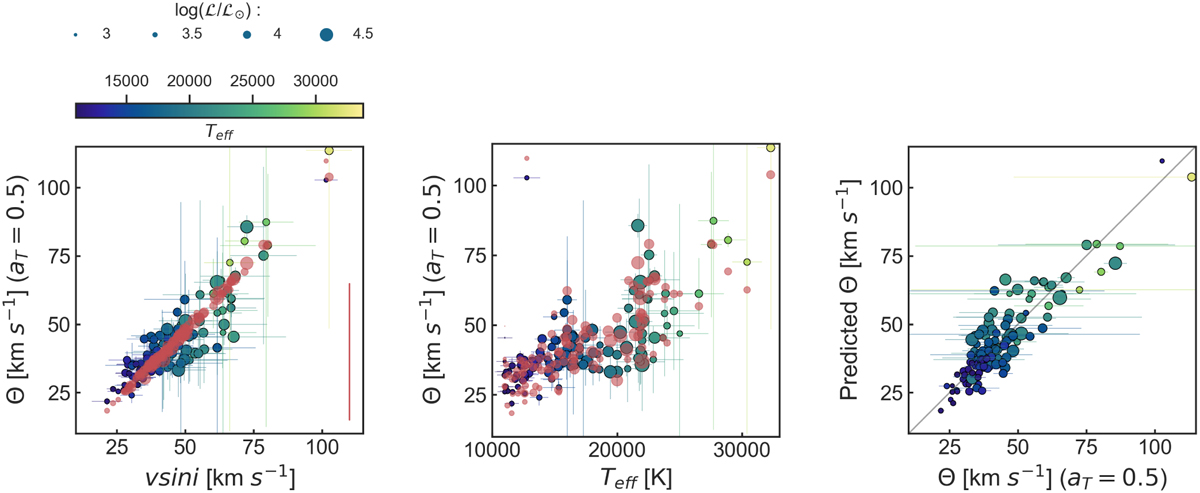
Results of the multivariate linear regression models for Θ. Left panel: comparison between Θ and ν sin i. The colours encode Teff, while the symbol sizes scale with spectroscopic luminosity. The red circles show the predicted Θ value from the best multivariate regression model in Eq. (5) for our LMC sample. The red vertical line in the corner indicates a typical error bar for the predicted Θ values and applies to all three panels. Middle panel: comparison between observed Θ and predictor Teff, where Θ predicted from Eq. (5) is colour coded in red. Right panel: comparison of Θ predicted from Eq. (5) and the measured values of Θ.
Current usage metrics show cumulative count of Article Views (full-text article views including HTML views, PDF and ePub downloads, according to the available data) and Abstracts Views on Vision4Press platform.
Data correspond to usage on the plateform after 2015. The current usage metrics is available 48-96 hours after online publication and is updated daily on week days.
Initial download of the metrics may take a while.