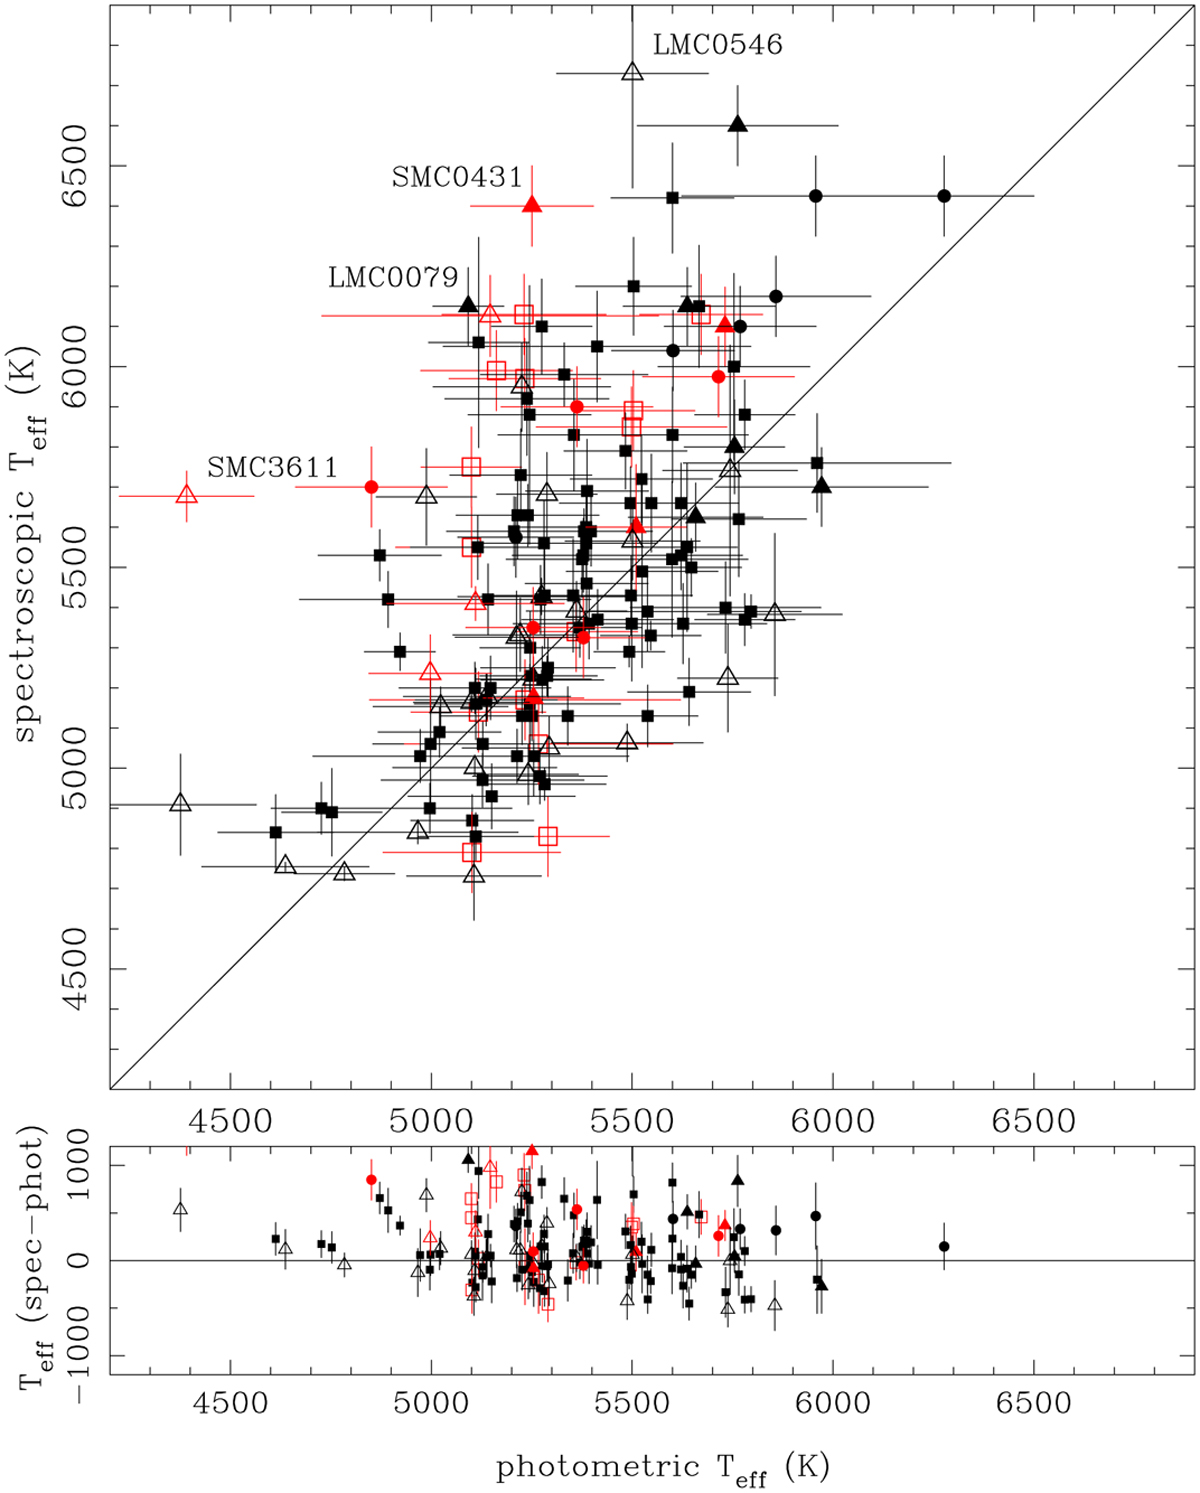
Fig. 9
Download original image
Comparison between the effective temperatures determined from the SED fitting and in the literature. Objects in the LMC are plotted in black and objects in the SMC in red. The one-to-one line is indicated. Stars where the absolute difference is larger than 1000 K are identified. Objects from reference 1 and 2 (see the note to Table 1) are plotted as filled squares, from reference 3 as open squares, from reference 4 as filled triangles, from reference 5 as open triangles, and from reference 6 as filled circles. In the lower panel, the difference between literature and photometric temperature is plotted.
Current usage metrics show cumulative count of Article Views (full-text article views including HTML views, PDF and ePub downloads, according to the available data) and Abstracts Views on Vision4Press platform.
Data correspond to usage on the plateform after 2015. The current usage metrics is available 48-96 hours after online publication and is updated daily on week days.
Initial download of the metrics may take a while.