Fig. 3
Download original image
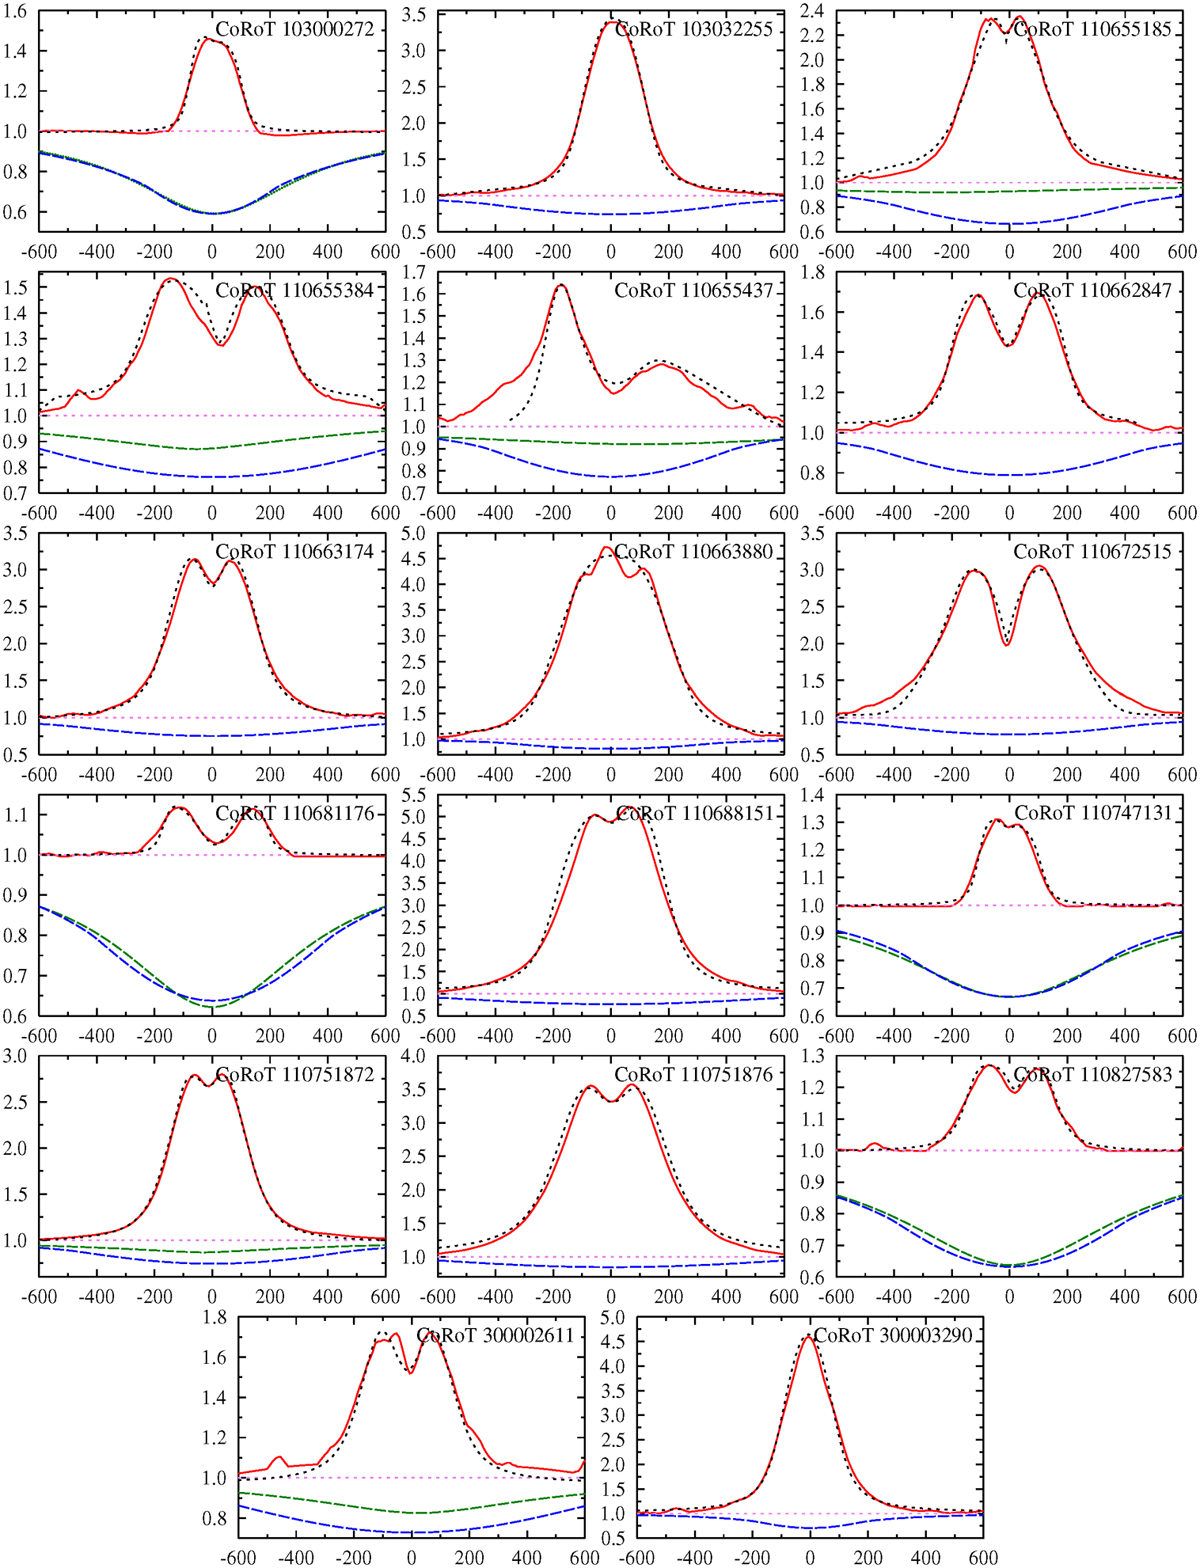
Smoothed Hα line-emission components (red profiles). The emission residual intensities are relative to the photospheric line calculated according to the astrophysical parameters (Teff, log g, V sin i) of each object. The figure shows the photospheric component broadened by rotation (blue profiles). It includes the empirical pseudo-photospheric component (green profiles, see Sect. 6.1) in cases of partial emission feeling up of the absorption photospheric line. For the stars 103000272, 110681176, 110747131, and 110827583, the fit of the observed pseudo-photospheric absorption component closely reproduces the actual photospheric line.
Current usage metrics show cumulative count of Article Views (full-text article views including HTML views, PDF and ePub downloads, according to the available data) and Abstracts Views on Vision4Press platform.
Data correspond to usage on the plateform after 2015. The current usage metrics is available 48-96 hours after online publication and is updated daily on week days.
Initial download of the metrics may take a while.