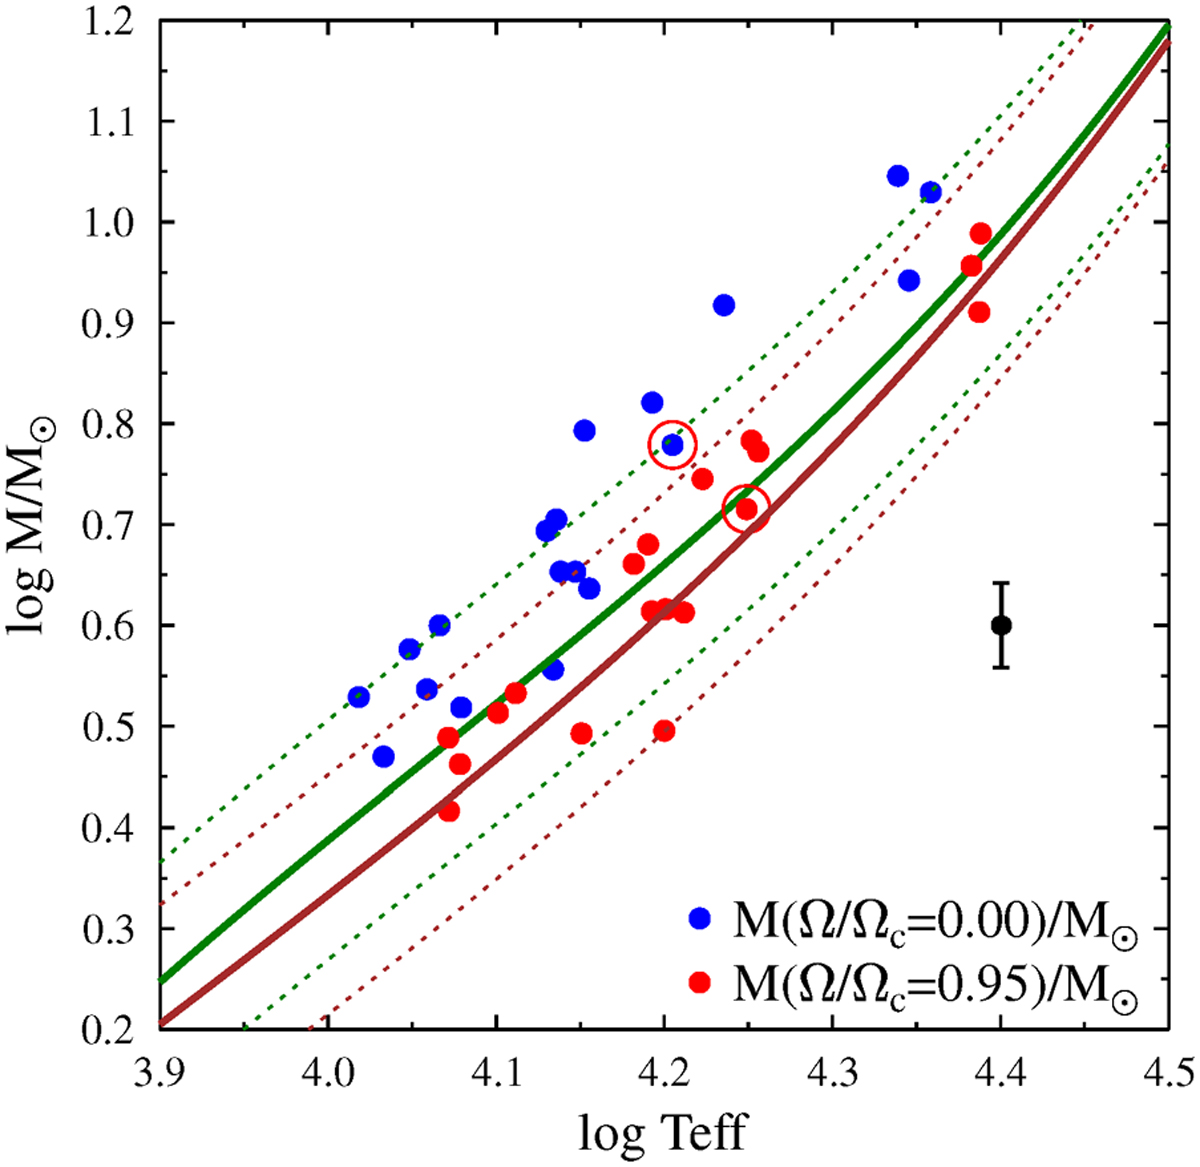
Fig. 11

Download original image
Comparison of Be stellar masses obtained in this paper with those of non-Be stars against the effective temperature. Blue dots represent the masses obtained from the apparent astrophysical parameters. Red dots represent the pnrc stellar masses determined for Ω/Ωc = 0.95. The green curve and the dotted green lines represent the average empirical relation curve with the error margins obtained by Harmanec (1988,  ) The red curve and the dotted brown lines represent the average empirical relation with the error margins obtained from LAMOST data Xiong et al. (2023,
  ) The typical error bar that characterizes the apparent and pnrc mass determinations is also shown. The points with a red circle identify the star Nº 5.
Current usage metrics show cumulative count of Article Views (full-text article views including HTML views, PDF and ePub downloads, according to the available data) and Abstracts Views on Vision4Press platform.
Data correspond to usage on the plateform after 2015. The current usage metrics is available 48-96 hours after online publication and is updated daily on week days.
Initial download of the metrics may take a while.


