Fig. 9.
Download original image
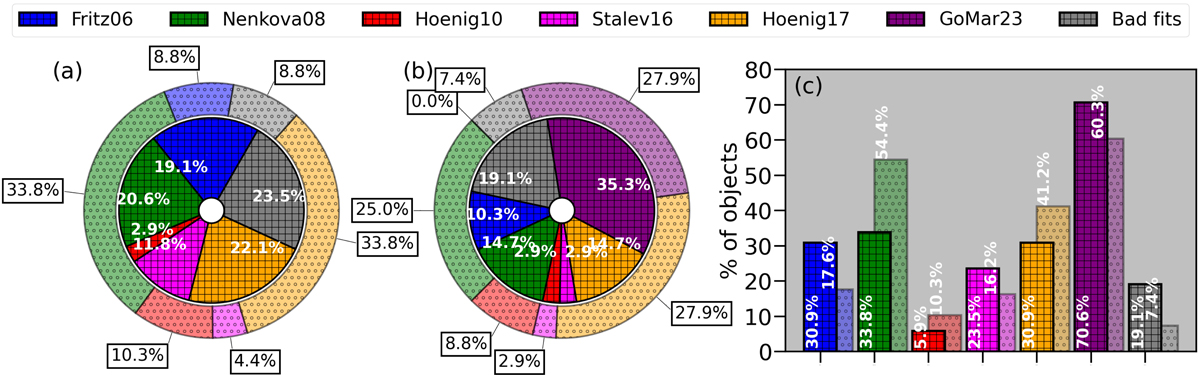
Panels a and b show the percentage of object best fitted with each of the models tested before (panel a) and after (panel b) the inclusion of GoMar23 model. The inner (squared-filled) and outer (circle-filled) pie charts show the results without and with foreground extinction in the spectral fits, respectively. Panel c shows the final percentage of objects best fitted to each model when including statistically similar fits using AIC probability (see text). The square-filled and circle-filled areas show the results without and with foreground extinction in the spectral fits, respectively.
Current usage metrics show cumulative count of Article Views (full-text article views including HTML views, PDF and ePub downloads, according to the available data) and Abstracts Views on Vision4Press platform.
Data correspond to usage on the plateform after 2015. The current usage metrics is available 48-96 hours after online publication and is updated daily on week days.
Initial download of the metrics may take a while.