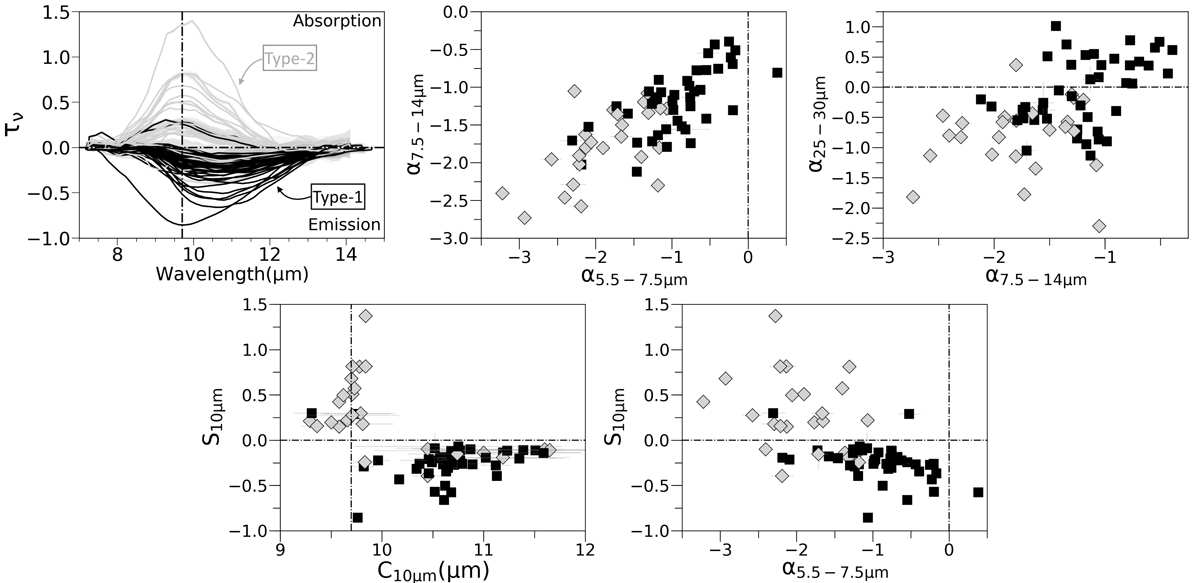
Fig. 3.
Download original image
Shape of the 9.7 μm silicate feature in optical depth units for our AGN sample (see text, top-left). Black and gray lines show type-1 and type-2 AGN, respectively. Observational diagrams for the AGN sample: 7.5–14 μm versus 5.5–7.5 μm slopes (top-middle); 25–30 μm versus 7.5–14 μm slopes (top-right); S10 μm versus C10 μm (bottom-left), and S10 μm versus 5.5–7.5 μm slope (bottom-right). Black squares and gray diamonds show the measurements in the Spitzer spectra for type-1 and type-2 AGN, respectively.
Current usage metrics show cumulative count of Article Views (full-text article views including HTML views, PDF and ePub downloads, according to the available data) and Abstracts Views on Vision4Press platform.
Data correspond to usage on the plateform after 2015. The current usage metrics is available 48-96 hours after online publication and is updated daily on week days.
Initial download of the metrics may take a while.