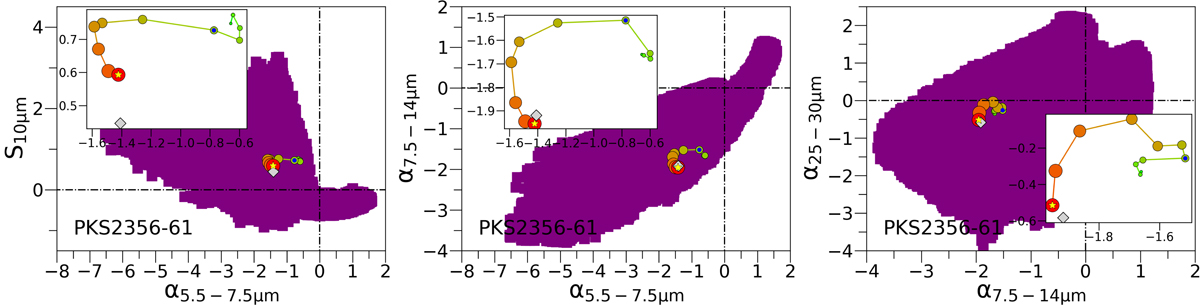
Fig. 14.
Download original image
Effect of the maximum grain size on the diagrams of spectral shapes for the type-2 AGN PKS 2356-61. It shows the locus of the SEDs computed using the best-fit parameters and varying the maximum grain size Psize from 0.01 to 10 μm (i.e., ⟨P⟩ from 0.007 to 3.41 μm). The spectral shape diagrams are Silicate depth versus α5.5 − 7.5 μm (left panels), α7.5 − 14 μm versus α5.5 − 7.5 μm slopes (middle panels), and α25 − 30 μm versus α7.5 − 14 μm (right panels). The empty-filled distribution is that from the entire SED library for GoMar23 model. Green small dots correspond to smaller grain sizes and redder and larger dots correspond to larger grain sizes (linked with lines). We mark as a blue dot the locus of the resulting values for the SEDs with Psize = 0.25 μm (⟨P⟩ = 0.097 μm) and as a yellow star the locus of the resulting values for the best fitted SED. The type-1 AGN are marked as black squares and type-2 AGN as gray diamonds.
Current usage metrics show cumulative count of Article Views (full-text article views including HTML views, PDF and ePub downloads, according to the available data) and Abstracts Views on Vision4Press platform.
Data correspond to usage on the plateform after 2015. The current usage metrics is available 48-96 hours after online publication and is updated daily on week days.
Initial download of the metrics may take a while.