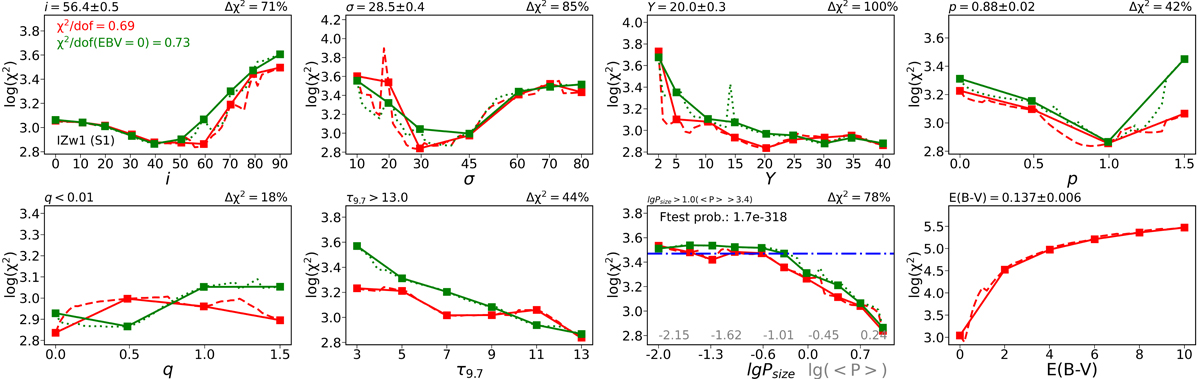
Fig. 11.
Download original image
Convergence of χ2 for each parameter of GoMar23 model for IZw1. Squares show the value of χ2 at the given values of the parameters sampled in GoMar23 grid (continuous line linearly links these black squares). Dashed lines show the internal interpolation performed by XSPEC. Green and red squares and lines report the results before and after the foreground extinction is included in the spectral fit procedure. The best value for each parameter is shown above the upper-left corner of each panel (when including foreground extinction). The top-left panel shows the resulting χ2/d.o.f.(sigma) in the upper-left corner. The percentage of variation of χ2 compared to the minimum value is shown above the upper-right corner of each panel. The horizontal blue dot-dashed line in the third-column lower panel shows the χ2 computed when the grain size is fixed to 0.25 μm. Note in this panel for Psize we also include the f-test probability that the grain size is consistent with 0.25 μm (see text). This panel also shows the x-axis expressed in terms of the average grain size in light-gray colors.
Current usage metrics show cumulative count of Article Views (full-text article views including HTML views, PDF and ePub downloads, according to the available data) and Abstracts Views on Vision4Press platform.
Data correspond to usage on the plateform after 2015. The current usage metrics is available 48-96 hours after online publication and is updated daily on week days.
Initial download of the metrics may take a while.