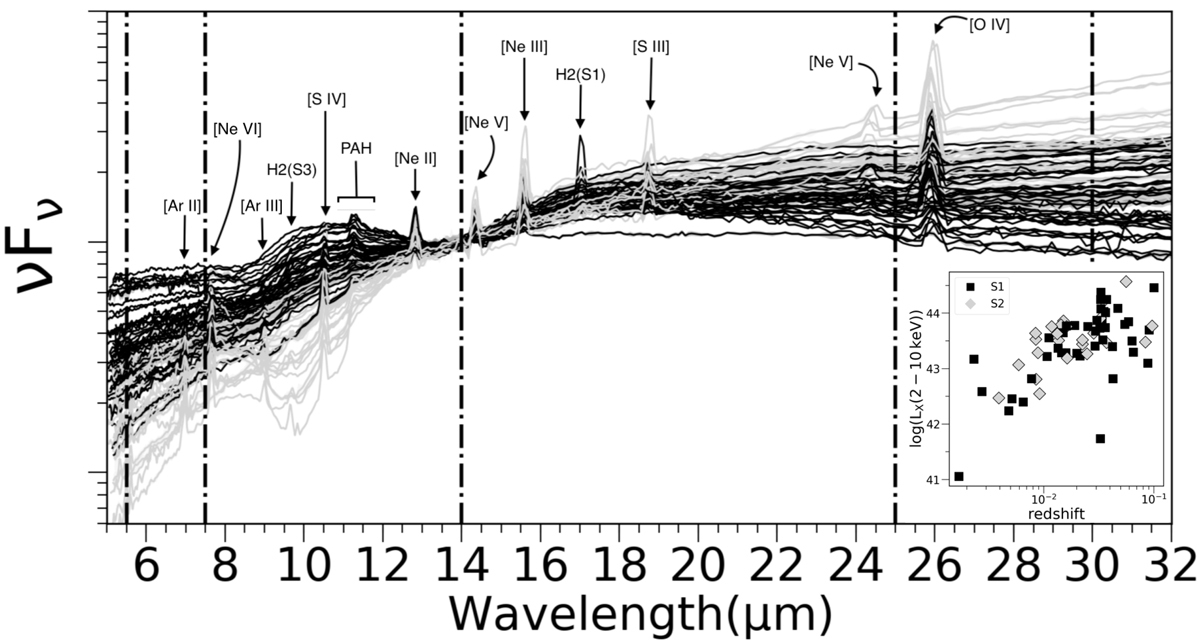
Fig. 1.
Download original image
Spectra of our sample of 68 AGN normalized to the flux at 14 μm. Type-1 and type-2 AGN are shown in black and gray, respectively. Vertical dot-dashed lines indicate the locus of the wavelengths chosen to compute the spectral slopes (see text). The bottom-right inset shows the distribution of X-ray luminosities versus redshift in our sample.
Current usage metrics show cumulative count of Article Views (full-text article views including HTML views, PDF and ePub downloads, according to the available data) and Abstracts Views on Vision4Press platform.
Data correspond to usage on the plateform after 2015. The current usage metrics is available 48-96 hours after online publication and is updated daily on week days.
Initial download of the metrics may take a while.