Fig. 9
Download original image
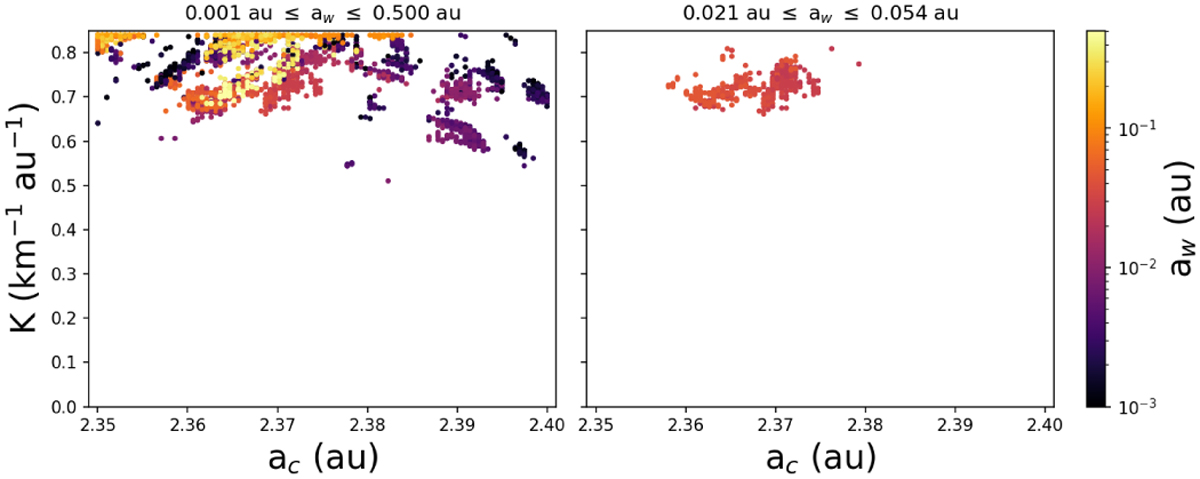
Demonstration of how the widths of the aw method were selected. The color indicates the width of the lobes. Each point shows the best found slope and vertex. In the left panel, there are 4200 points (seven values of the υc, 20 iterations of the diameters uncertainty, and 30 lobe widths.) The right panel is a filtered version of the left, only including lobe widths that converge stably to a solution and includes 700 points.
Current usage metrics show cumulative count of Article Views (full-text article views including HTML views, PDF and ePub downloads, according to the available data) and Abstracts Views on Vision4Press platform.
Data correspond to usage on the plateform after 2015. The current usage metrics is available 48-96 hours after online publication and is updated daily on week days.
Initial download of the metrics may take a while.