Fig. 5
Download original image
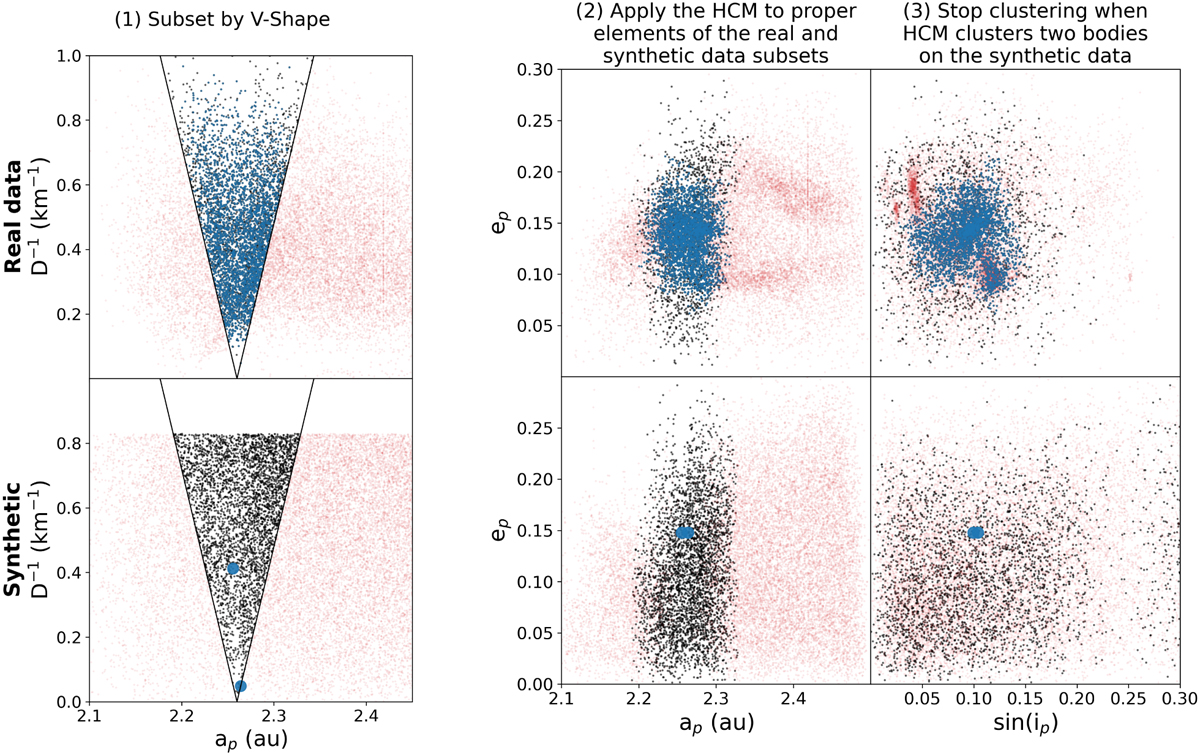
Demonstration of the V-shape-constrained HCM. The top row depicts the real data while the bottom shows the synthetic background of Deienno et al. (2021). The red bodies are a priori rejected since they are exterior to the family’s V-shape. The blue bodies are those clustered by the HCM. In the bottom panels, the two bodies are enlarged for clarity and only two bodies are clustered because forming a cluster on the synthetic dataset determines the υc (clustering threshold) for the real data. Thus, the blue bodies in the top plot correspond to family members. The black bodies are those who were not a priori rejected but also not clustered at the given υc. The plots on the right show the same dataset as the left column but plotted in proper element space, which is the data space to which the HCM is applied.
Current usage metrics show cumulative count of Article Views (full-text article views including HTML views, PDF and ePub downloads, according to the available data) and Abstracts Views on Vision4Press platform.
Data correspond to usage on the plateform after 2015. The current usage metrics is available 48-96 hours after online publication and is updated daily on week days.
Initial download of the metrics may take a while.