Fig. 10
Download original image
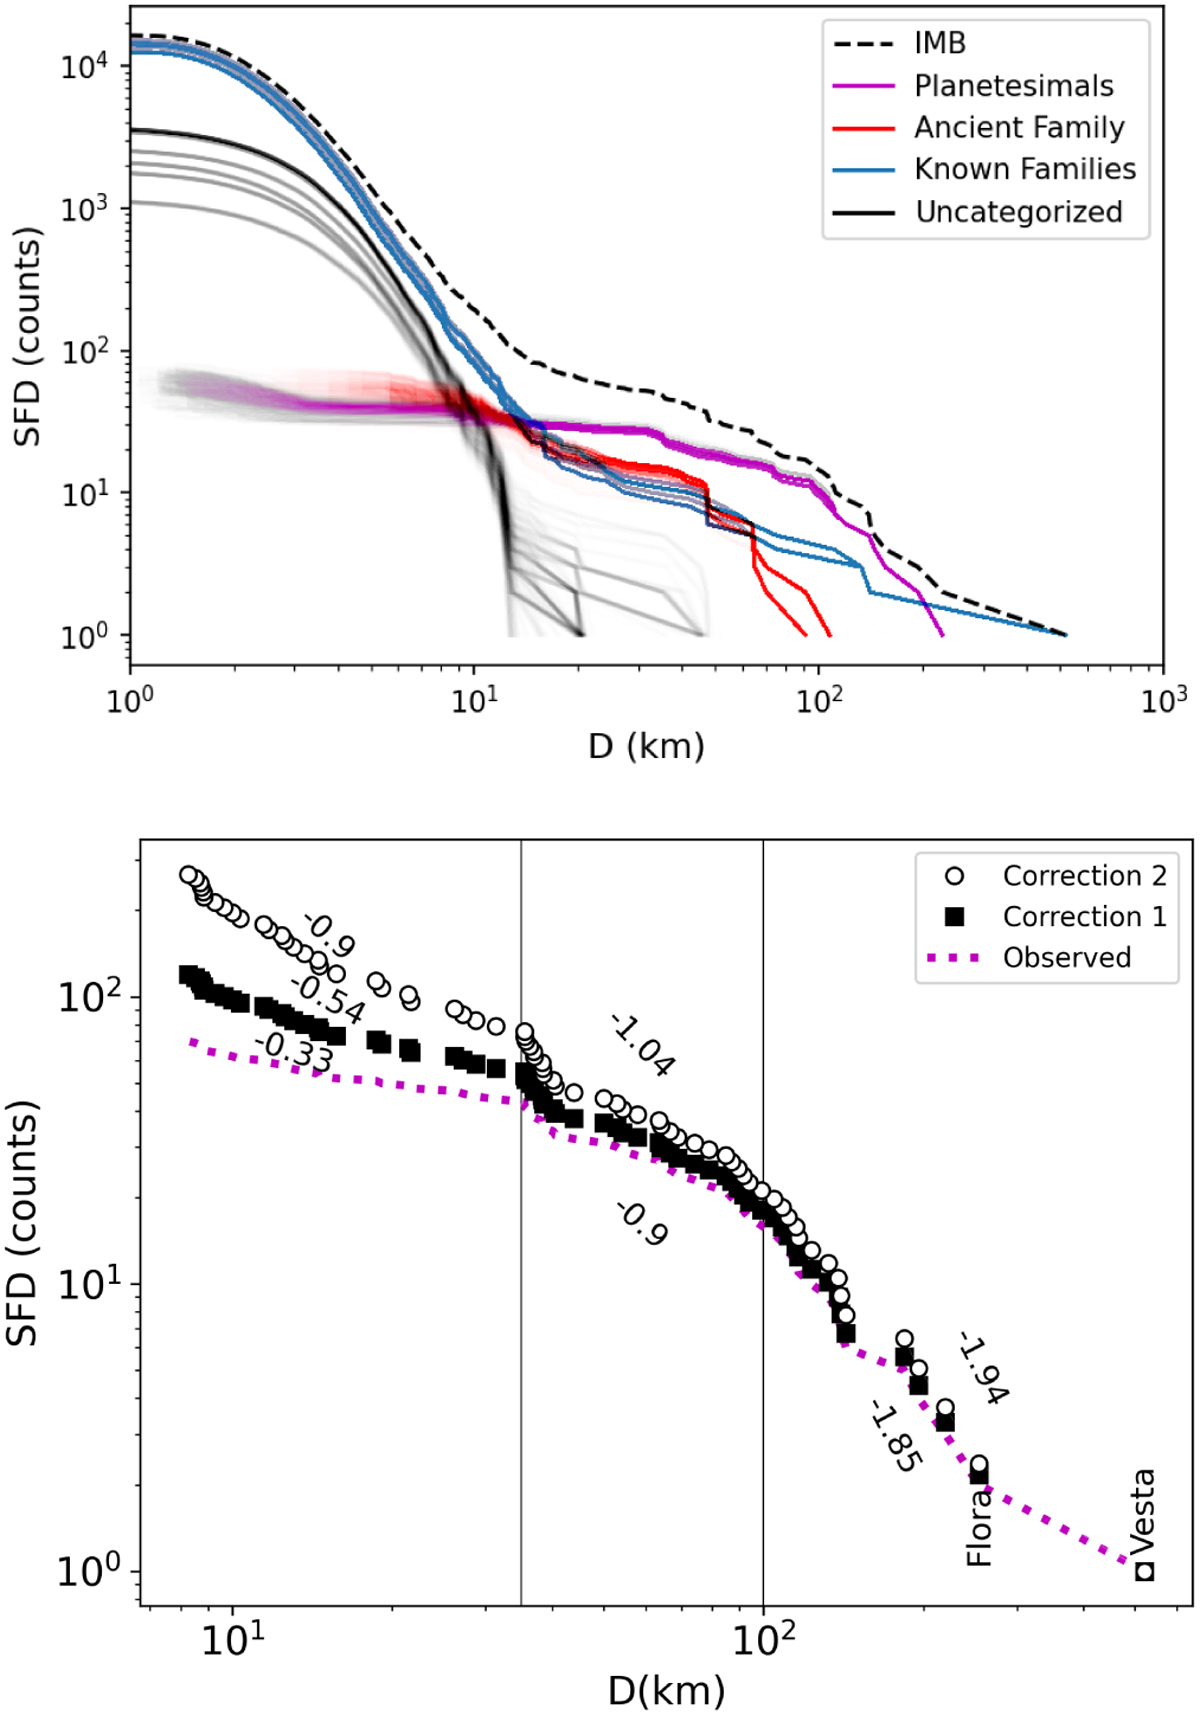
SFDs of various collections of asteroids. Top: cumulative SFD of five different cases. The high-pV inner main belt is indicated as IMB, the blue Known Families are the reassessed families listed in Table 1. The uncategorized objects are those that do not belong to the known families, the newly discovered ancient family, or the planetesimals. Multiple curves are drawn according to each iteration in order to reflect the uncertainty. There are 700 highly transparent curves drawn for the Ancient Family, the Planetesimals, and the Uncategorized. There are seven known family curves drawn, and one curve for the inner main belt. Bottom: purple curve labeled "Observed" is a modified version of the Planetesimals from the top panel. This list is a compilation of planetesimals detected with a greater than 1σ confidence, identified planetesimals from previous works, and a few artificial asteroids that should be hidden behind the V-shapes of the ancient families, as explained in the appendix. Next, we provide two different corrections for depletion. Both consider the same dynamical loss while correction 2 accounts for more collision loss than correction 1, as explained in the text. We provide the power-law slope in three different regions: below 35 km, between 35 and 100 km, and above 100 km. We note that the three slopes are reported below 35 km, yet above we only report Correction 1 and 2 for clarity.
Current usage metrics show cumulative count of Article Views (full-text article views including HTML views, PDF and ePub downloads, according to the available data) and Abstracts Views on Vision4Press platform.
Data correspond to usage on the plateform after 2015. The current usage metrics is available 48-96 hours after online publication and is updated daily on week days.
Initial download of the metrics may take a while.